
WTI crude oil is consolidating after a sharp decline, with the supplied five-hour chart snapshot showing price around $93.81. The market is trapped between $91.20 support and $95.60 resistance, leaving traders focused on whether the current pause develops into another downside move or becomes a reversal setup.
The technical structure resembles a bear flag, a pattern that can develop when prices pause after a strong decline before potentially extending the previous move. However, the pattern is not confirmed until price breaks decisively below its lower boundary.
The broader oil market remains sensitive to Middle East supply risks. Reuters reported Tuesday that WTI was trading around $94, while Brent climbed above $106 as concerns over disruptions through the Strait of Hormuz continued.
$91.20 Support Holds the Key
The $91.20 area is the most important downside level in the supplied setup. The chart shows several recent reactions around this zone, making a five-hour close below it significant for the bearish case.
Meanwhile, the short-term moving averages are creating overhead pressure. The supplied chart places the 20-period SMA at $93.41, while the 50-period SMA sits at $96.18. The SuperTrend near $95.94 adds another resistance layer.
- Support: $91.20
- Resistance: $95.60–$96.20
- 200-period SMA: $88.87
- ATR: 2.03, or about 2.16%
Current Investing.com technical data also shows a bearish short-term configuration, with its moving-average summary registering more sell signals than buy signals.
Momentum Signals Remain Mixed
Momentum indicators are less uniform than the moving averages. The supplied chart shows the MACD line at -0.28 crossing above its -0.56 signal line, suggesting that selling pressure may be losing some momentum. That improvement alone, however, does not invalidate the broader bearish structure.
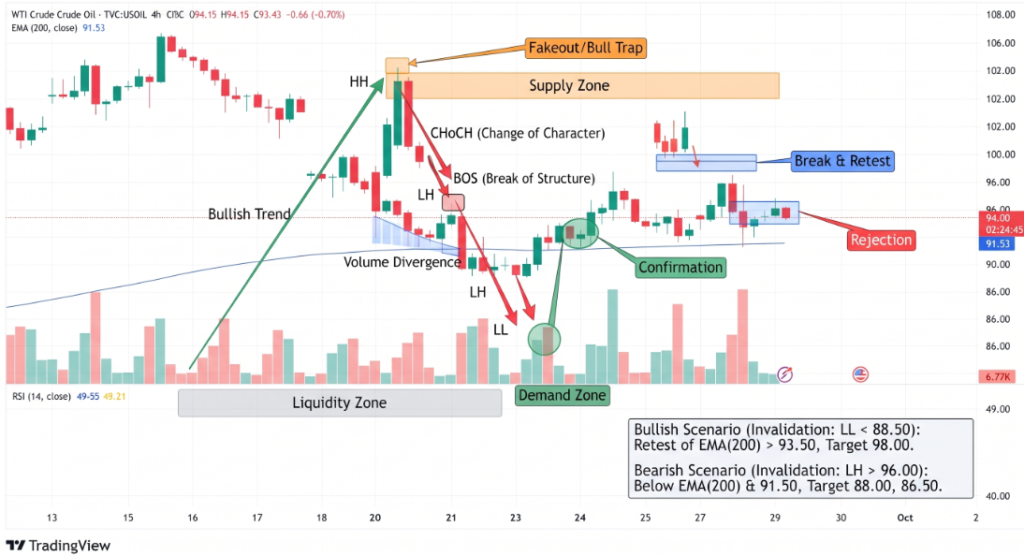
The Ichimoku Cloud remains between approximately $93.32 and $97.73, leaving WTI below a substantial overhead technical area. A move above the upper resistance cluster would therefore provide stronger evidence that the bear flag has failed.
The latest Investing.com technical snapshot likewise places WTI near $93.17 and classifies the broader technical setup as Strong Sell, although indicators such as RSI remain closer to neutral.
Conclusion
WTI crude oil remains caught between $91.20 and $95.60, making the range more important than short-term fluctuations around $93.81. A decisive break below $91.20 would strengthen the bear-flag continuation scenario, while a sustained move through $95.60–$96.20 would weaken the bearish structure. Traders should also watch volatility and volume because a break without confirmation could produce another sharp reversal.
Sources & Methodology
Primary-source standard: Market-moving facts should link to original data releases, regulator notices, company filings or official project announcements whenever available. Secondary reporting is used for additional context, not as a substitute for original evidence.
Page last reviewed: