
West Texas Intermediate (WTI) crude oil is hovering near $90.96 in the supplied five-hour chart snapshot, caught between $89 and $92 as traders weigh competing technical signals. The immediate direction remains unclear: a bullish MACD crossover suggests selling pressure may be easing, but resistance from longer-term moving averages and the Ichimoku Cloud continues to limit gains. A decisive move above $93.32 or below $87.19 could provide a clearer signal for the next directional move.
Oil Consolidates as Momentum Conflicts
WTI has entered a consolidation phase after a recent correction. Its price sits above the 20-period simple moving average (SMA) at $89.97 but below the 50-period SMA at $91.03 and close to the 200-period SMA at $90.98. This convergence reflects a market struggling to establish a clear trend.
The MACD indicator has turned bullish, with its reading at 0.03 against a signal reference of -0.20. However, the Ichimoku Cloud places resistance near $91.70, while the SuperTrend indicator points to a stronger barrier at $93.32.
Volatility is also subdued. The Average True Range (ATR) stands at 1.61, or approximately 1.77% according to the supplied analysis. ATR measures the size of price movements, not their direction. Lower readings can accompany consolidation, although they do not guarantee an imminent breakout.
The broader market backdrop remains important. Reuters reported that WTI fell to around $90.74 on Friday, October 9, as President Donald Trump’s comments about delaying military action against Iran eased some immediate supply concerns. Nevertheless, geopolitical tensions and possible disruptions to oil flows remain significant risks for prices.
Breakout Levels and Trading Scenarios
The broader technical range extends from $87.19 to $93.32. Until price leaves this zone convincingly, traders face the possibility of false breakouts and abrupt reversals.
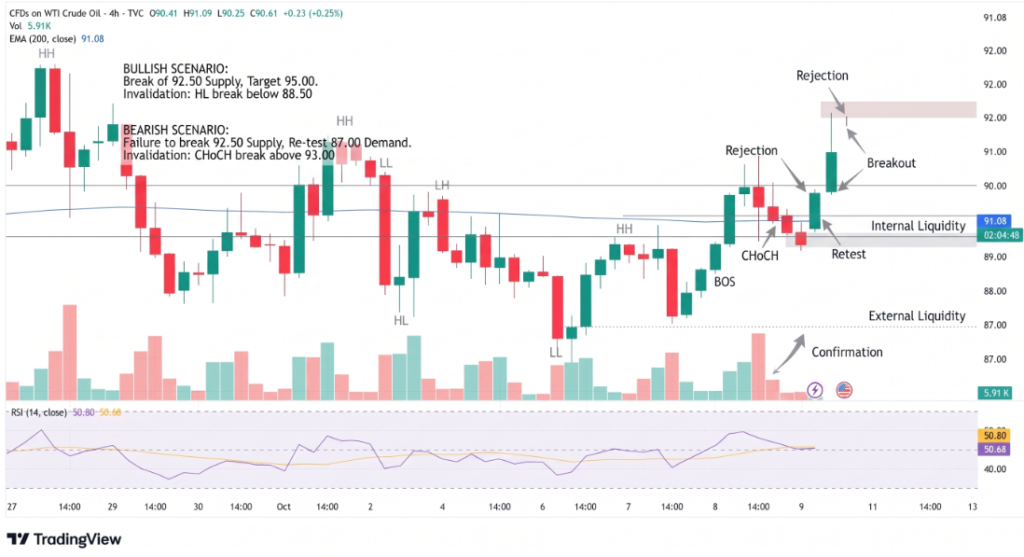
Key levels to monitor include:
- $93.32 resistance: A sustained break above this level would strengthen the bullish case.
- $91.70 resistance: The Ichimoku Cloud level that buyers must overcome first.
- $89.97 support: The 20-period SMA, which could provide short-term support.
- $89.10 pivot: The 50% Fibonacci retracement level identified in the chart.
- $87.19 support: A decisive breakdown could extend the bearish move.
A bullish setup would require price to clear $93.32 and hold above it, while a bearish scenario would gain traction if WTI falls below $87.19. The 38.2% Fibonacci retracement near $93.27 reinforces the upper resistance area.
Conclusion
WTI crude oil remains directionless near $90.96, with mixed momentum signals and fading volatility keeping traders cautious. A break above $93.32 could open the way for further gains, while a drop below $87.19 would signal renewed downside pressure. Until either boundary gives way, the $89–$92 zone remains vulnerable to choppy trading. These levels reflect the supplied chart snapshot, not guaranteed entry or exit points.
Sources & Methodology
Primary-source standard: Market-moving facts should link to original data releases, regulator notices, company filings or official project announcements whenever available. Secondary reporting is used for additional context, not as a substitute for original evidence.
Page last reviewed: