Silver is approaching a key resistance zone after trading near $57.9975 on the supplied five-hour chart. The $58.50–$59.00 area brings together several technical indicators, including the 20-period Simple Moving Average (SMA), a 50% Fibonacci retracement and the SuperTrend indicator. Although a bullish MACD crossover points to recovering momentum, the broader trend remains bearish. Traders are watching whether silver can break through resistance or retreat toward the recent swing low at $55.56.
Silver Faces Resistance at $58.50–$59
The $58.50–$59.00 range represents a significant technical barrier because multiple indicators converge around the same area. The 20-period SMA tracks the average closing price over the previous 20 candles, while Fibonacci retracement levels identify potential resistance during a recovery from a decline. The SuperTrend indicator also helps identify the prevailing trend and possible reversal points.
Silver remains below its 50-period and 200-period moving averages, keeping the broader technical outlook under pressure. A sustained move above $59.00 would challenge that bearish structure, but a brief spike above resistance would not, by itself, establish a lasting reversal.
Momentum signals offer a mixed picture. The Moving Average Convergence Divergence (MACD) has crossed above its signal line, improving from -0.897 to -0.836. This suggests selling momentum may be easing. However, the Relative Strength Index (RSI) stands at 44.21, below the neutral 50 threshold, indicating that buyers have not yet established strong control.
Key Silver Support and Resistance Levels
The immediate battle is between the $58.50–$59.00 resistance cluster and support near $55.56. A failure at resistance could leave the recent rebound vulnerable, while a confirmed breakout may encourage additional buying.
Traders are monitoring these levels:
- $59.00: Upper resistance boundary and potential bullish breakout threshold.
- $58.50: Lower edge of the key resistance cluster.
- $57.00–$58.00: Intermediate zone where choppy price action may generate false signals.
- $55.56: Recent swing low and key downside reference.
A sustained break below $55.56 would strengthen the bearish case by indicating that sellers have pushed prices beneath the recent low. Conversely, a move above $59.00 followed by continued buying would weaken the immediate bearish outlook.
Silver Outlook: Breakout or Reversal?
The next move depends on whether momentum improves enough to overcome resistance. If silver stalls near $58.50–$59.00, sellers may attempt to push the market lower. If buyers force a decisive breakout, short sellers could close positions, adding to upward pressure.
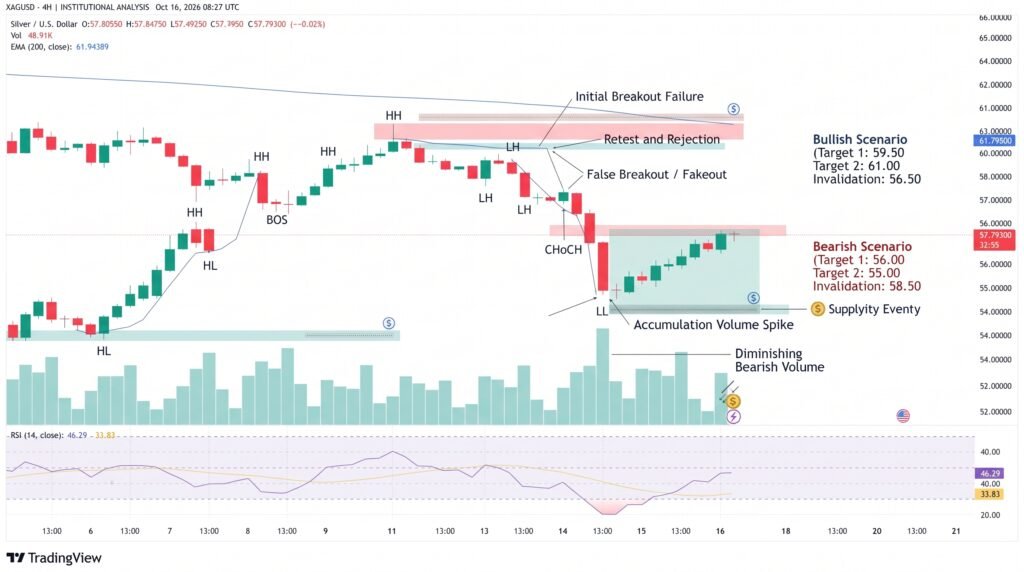
Trading within the $57.00–$58.00 area carries elevated whipsaw risk. With momentum indicators sending mixed signals, waiting for a confirmed break may offer clearer directional evidence than reacting to small price fluctuations.
The main risk for bearish traders is a strong rally through $59.00, while bullish traders face the possibility that the rebound will fail beneath resistance.
Conclusion
Silver’s technical outlook remains cautious as the price approaches the $58.50–$59.00 resistance zone. A sustained break above $59.00 could challenge the bearish trend and support a stronger recovery. Conversely, a decline below $55.56 would reinforce selling pressure and signal renewed downside risk. Until either level breaks decisively, traders may benefit from monitoring price confirmation alongside MACD and RSI signals rather than assuming the recent rebound marks a lasting reversal.
Sources & Methodology
Primary-source standard: Market-moving facts should link to original data releases, regulator notices, company filings or official project announcements whenever available. Secondary reporting is used for additional context, not as a substitute for original evidence.
Page last reviewed: