
Bitcoin is facing renewed short-term selling pressure after retreating from its recent September peak near $87,364. A five-hour chart snapshot places BTC at $83,119, with price losing short-term moving-average support and increasing attention on the $81,194-$81,689 area. Broader September 28 market data also showed Bitcoin trading in the low-$83,000s, confirming that the cryptocurrency remains below its recent highs.
Bitcoin Sellers Test Key Support
The latest pullback has weakened Bitcoin’s short-term technical structure. The supplied five-hour chart shows BTC below its 20- and 50-period simple moving averages, while momentum indicators remain tilted lower. A MACD reading of 97.04 against a signal line at 301.42 points to negative momentum, although these readings are specific to the chart timeframe.
The Relative Strength Index stands at 42.74, keeping BTC above the conventional oversold threshold of 30 but below the 50 midpoint that often separates positive and negative momentum. The latest candle is also described as a bearish Marubozu, indicating strong selling pressure during the measured period.
Bitcoin’s recent price history reinforces the importance of the current correction. BTC climbed from roughly $80,099 on September 20 to a September 21 high of $87,364 before consolidating. It subsequently traded near $84,000, leaving the market focused on whether the latest decline develops into a deeper retracement.
$81,194 Zone Holds the Focus
The $81,194-$81,689 region combines several technical references in the supplied chart, including the 50% Fibonacci retracement and the Ichimoku Cloud base. A sustained break below this area would expose the longer-term 200-period SMA near $78,590.
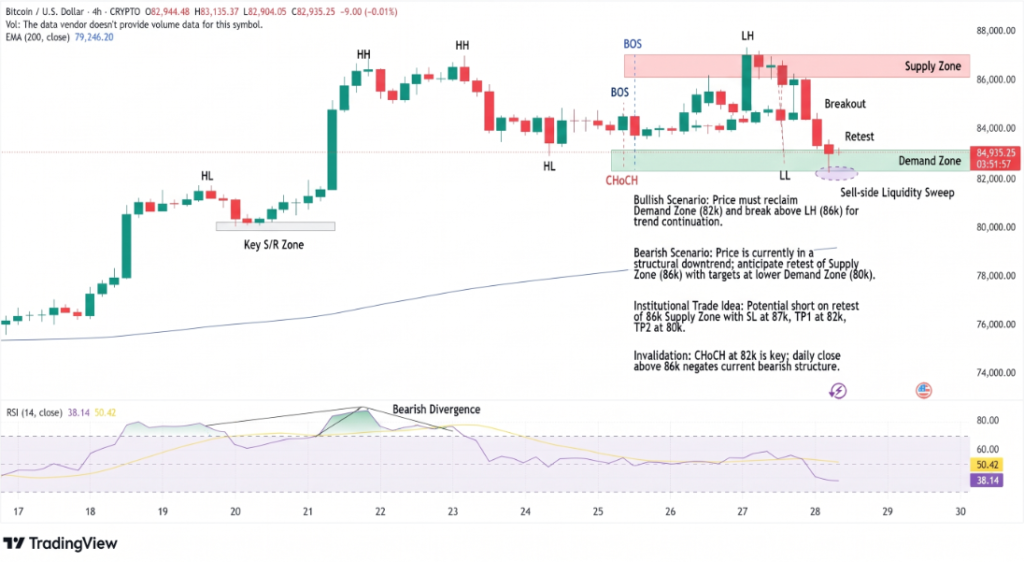
Key levels for traders include:
- Support: $81,194-$81,689
- Resistance: $84,109
- 200-SMA: $78,590
The $84,109 level represents the first major recovery threshold because it aligns with the 20-period SMA and the upper boundary of the Ichimoku Cloud in the supplied setup. Until Bitcoin recovers that area, the five-hour structure remains vulnerable to additional selling.
The broader market also shows why volatility remains important. Investing.com data recorded a September 28 intraday range from roughly $83,216 to $84,992, illustrating the size of Bitcoin’s short-term swings.
Conclusion
Bitcoin’s immediate technical structure remains under pressure after its retreat from $87,364. The $81,194-$81,689 zone is the key downside area, while $84,109 marks the first important level for a recovery in the supplied five-hour setup. A break below support would bring the $78,590 200-SMA into focus, whereas sustained trading above $84,109 would weaken the current bearish setup. Traders should distinguish the chart-specific levels from live exchange prices, which can vary slightly across venues.
Sources & Methodology
Primary-source standard: Market-moving facts should link to original data releases, regulator notices, company filings or official project announcements whenever available. Secondary reporting is used for additional context, not as a substitute for original evidence.
Page last reviewed: