
Solana (SOL) is consolidating near $120 after a sharp two-week advance, while institutional demand and expanding on-chain activity provide important support for the market. U.S. spot Solana ETFs attracted $188.21 million in net inflows from September 21 to 25, their second-highest weekly total since launch. The network is also reporting record stablecoin supply and real-world asset activity. These developments come as SOL tests a key resistance area near $123.96, leaving traders focused on whether the recent advance can extend.
Solana ETFs Draw $188 Million
U.S. spot Solana ETFs recorded $188.21 million of combined net inflows last week, according to SoSoValue data. The total was second only to the approximately $199.2 million collected during the products’ launch week. Friday alone generated a record daily inflow of roughly $86.7 million, highlighting the strength of demand late in the week.
All seven tracked Solana ETFs recorded positive flows during the week. Bitwise’s BSOL accounted for the largest share, attracting about $128.46 million, or roughly 68% of the weekly total. The combined inflows pushed cumulative net ETF inflows to about $1.6 billion.
ETF flows do not guarantee higher spot prices, but sustained creations provide a measurable indication of investor demand for regulated SOL exposure.
Stablecoins and RWAs Hit Records
Solana’s on-chain activity is also expanding. The network’s official account reported that stablecoin supply reached an all-time high of $17.3 billion, while its real-world asset ecosystem surpassed $4.6 billion across more than 3,000 assets. Tokenized equity holders also crossed the 1 million mark.
Independent Q3 data from Birdeye placed Solana’s RWA market at about $4.49 billion and confirmed that cumulative tokenized-stock holders had exceeded one million. The data also showed 8.38 million wallets holding SOL, up 20.5% from the previous quarter.
Key ecosystem figures include:
- $17.3 billion: reported stablecoin supply.
- $4.6 billion+: reported RWA ecosystem value.
- 1 million+: cumulative tokenized equity holders.
SOL Tests $123.96 Resistance
SOL traded around $120.02 on September 28, after reaching an intraday high near $122.88. The token remains above its longer-term moving averages, although short-term momentum has weakened as price retreats from recent highs.
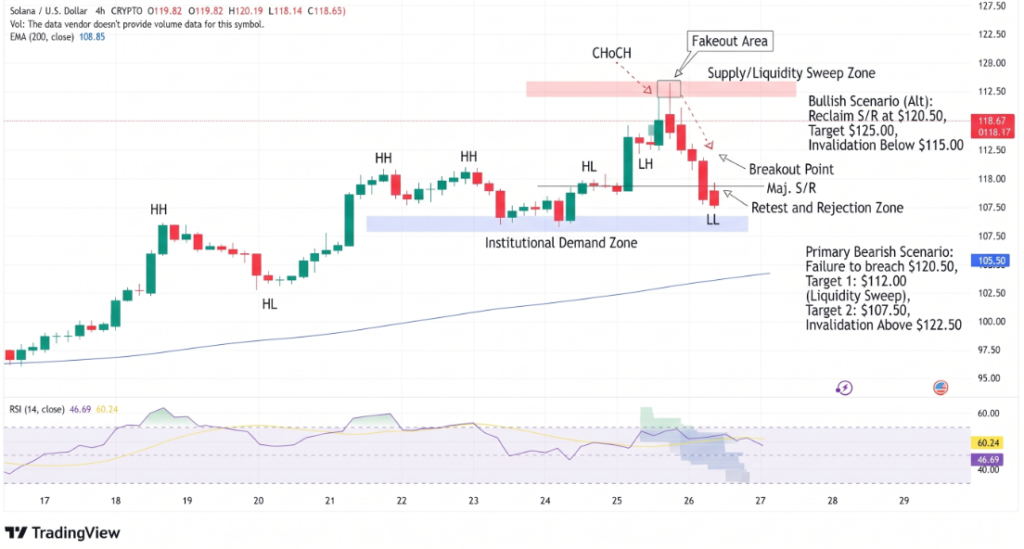
The supplied technical setup places the 50-day EMA at $101.81, with longer-term 100-day and 200-day EMAs near $93.94 and $94.65. The original analysis also identifies $96.19 as horizontal support, while $81.96 and $77.07 represent deeper support zones.
On the upside, $123.96 is the immediate technical barrier. A daily close above that level would strengthen the continuation setup, while rejection could leave SOL consolidating above the moving-average support structure.
Conclusion
Solana enters the new week with two distinct sources of market support: strong demand through spot ETFs and expanding activity across stablecoins and tokenized real-world assets. The $188.21 million weekly ETF inflow ranks as the second-highest since launch, while network metrics have reached fresh records. Technically, SOL must clear the $123.96 resistance area to extend the recent advance; otherwise, attention remains on the $101.81 50-day EMA and lower support levels.
Sources & Methodology
Primary-source standard: Market-moving facts should link to original data releases, regulator notices, company filings or official project announcements whenever available. Secondary reporting is used for additional context, not as a substitute for original evidence.
Page last reviewed: