
Pi Network’s PI token recovered on Tuesday after touching a record low of $0.0624 on Monday, November 9. The token gained more than 7%, trading around $0.0703 as buyers attempted to reverse five consecutive sessions of losses. Derivatives activity also improved, with futures Open Interest rising to $6.21 million. However, the recovery has yet to change the broader bearish technical structure: PI remains below its major moving averages and a descending resistance trendline near $0.0752.
PI Open Interest Signals Renewed Activity
The derivatives market is showing early signs of renewed participation. Data from Blockworks puts PI futures Open Interest at $6.21 million, up from $5.89 million a day earlier. That represents an increase of approximately 5.4% and suggests traders are rebuilding positions after the token’s sharp decline.
Open Interest measures the total value of outstanding futures contracts that have not been settled. An increase can indicate that new positions are entering the market, but it does not reveal whether traders are predominantly bullish or bearish. Price direction and funding rates are also needed to assess the strength of market positioning.
The improvement is therefore a sign of increased activity rather than confirmation of a sustained bullish reversal. After PI’s latest record low, traders will need to see continued demand and stronger spot-market buying before treating the derivatives recovery as a durable change in sentiment.
Pi Network Price Forecast: $0.0752
PI was trading near $0.0703 at the time of the market assessment, but the token remains below its 50-day and 200-day Exponential Moving Averages (EMAs), positioned at $0.0799 and $0.1085, respectively. These averages track recent price trends and can act as resistance when an asset trades beneath them.
The first major obstacle is a descending trendline near $0.0752, connecting the June 20 and August 22 highs. A sustained move above this barrier could open the way towards the 50-day EMA at $0.0799. A stronger recovery would still need to overcome the longer-term average at $0.1085.
Momentum indicators offer a cautious signal. The Relative Strength Index (RSI) stands near 35, recovering from oversold territory but remaining below the neutral 50 mark. Meanwhile, the Moving Average Convergence Divergence (MACD) remains negative, indicating that bearish momentum has not fully faded.
Key Support and Resistance Levels
The immediate technical picture leaves PI vulnerable if buyers fail to defend the rebound. The main levels traders are monitoring include:
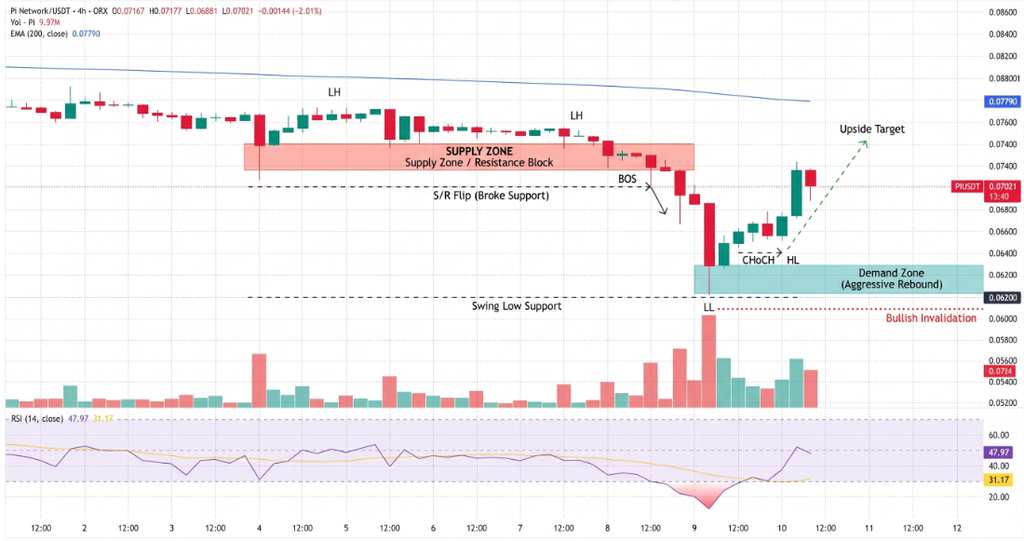
- Resistance: $0.0752, near the descending trendline.
- Secondary resistance: $0.0799, the 50-day EMA.
- Long-term resistance: $0.1085, the 200-day EMA.
- Downside support: $0.0516, the 127.2% Fibonacci extension.
The $0.0516 support level is calculated from the decline between $0.1394 and $0.0704. A break below it would expose PI to further downside, while holding above it would give buyers room to attempt another recovery.
Conclusion
PI’s rebound from $0.0624 and rising Open Interest suggest that selling pressure may be easing, but the broader trend remains weak. A sustained break above $0.0752 is needed to strengthen the recovery case. Until then, negative MACD momentum and resistance from the major EMAs leave the risk of another decline in place.
Sources & Methodology
Primary-source standard: Market-moving facts should link to original data releases, regulator notices, company filings or official project announcements whenever available. Secondary reporting is used for additional context, not as a substitute for original evidence.
Page last reviewed: