
Silver is trading near $61.27 on the five-hour chart, with buyers attempting to extend a short-term recovery against a broader bearish trend. The immediate test lies between $61.70 and $62.20, where technical resistance could limit further gains. Bullish momentum has improved, but silver remains below its 200-period moving average, suggesting the rebound has yet to establish a durable trend reversal. Traders are watching whether the metal breaks above resistance or retreats toward support at $59.50 and the October swing low at $58.73.
Silver Faces Resistance at $62.20
The technical picture for silver (XAG/USD) remains divided. The Moving Average Convergence Divergence (MACD) indicator has turned bullish, while the price is holding above its 20-period moving average. These signals suggest buyers have gained some short-term control.
However, the broader trend remains under pressure. Silver is trading below its 200-period moving average at $65.02, a widely followed indicator of longer-term price direction. The five-hour chart also places the Ichimoku cloud and the SuperTrend indicator near the $61.70–$62.20 resistance zone.
The convergence of these indicators creates a significant hurdle for bullish traders. The descending channel’s upper boundary and repeated rejections around $61.66–$61.95 reinforce the possibility that sellers will defend the area again.
A sustained five-hour candle close above $62.20 would provide a stronger indication that buying pressure is overcoming immediate resistance. Without that confirmation, an advance could prove temporary.
Bearish and Bullish Scenarios for XAG/USD
The next move depends on how silver behaves around the resistance cluster. A rejection would favor the prevailing downtrend, while a confirmed breakout could encourage short-term traders to pursue higher levels.
The main technical scenarios are:
- Bearish target: A decline toward $59.50, followed by the October swing low at $58.73 if selling intensifies.
- Bullish target: A decisive break above $62.20 could open a path toward $64.94, a major Fibonacci retracement level.
- Trend confirmation: A move below $58.73 would reinforce the bearish structure, while a recovery above $65.02 would weaken the broader bearish case.
The $64.94 target remains conditional rather than a guaranteed outcome. Silver would need to clear several layers of resistance before reaching it, and the prevailing downtrend raises the risk of a failed breakout.
Volatility and Trading Levels to Watch
Volatility remains important as silver approaches a closely contested price zone. The reported Average True Range (ATR) is 0.76, indicating an average movement of roughly $0.76 per five-hour bar under the stated chart settings. Relative to $61.27, that represents approximately 1.24%.
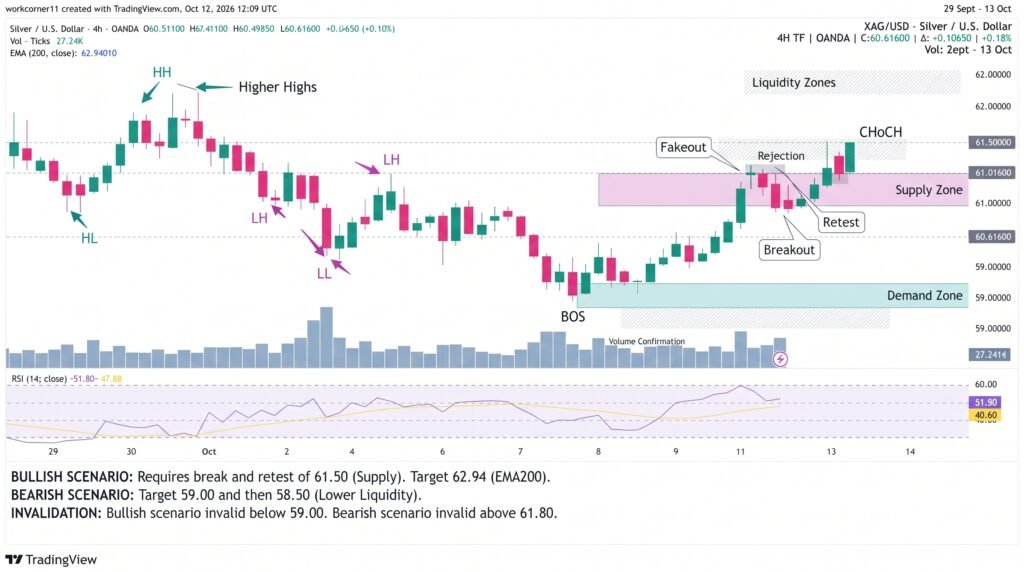
Volume provides another useful signal. Declining activity during the recovery may indicate limited conviction among buyers. A breakout accompanied by stronger trading volume would offer better confirmation than a price move unsupported by participation.
Traders can monitor three indicators closely: resistance at $62.20, support at $59.50 and the 200-period moving average at $65.02. These levels help distinguish a short-term rebound from a more meaningful change in direction.
Conclusion
Silver faces a critical technical test as it approaches the $61.70–$62.20 resistance zone. Bullish MACD momentum offers some support for a recovery, but the broader trend remains bearish while prices stay below the $65.02 moving average. A confirmed break above $62.20 could open the way toward $64.94, whereas rejection at resistance could send XAG/USD toward $59.50 and potentially $58.73. Traders should monitor price closes, trading volume and volatility before treating either scenario as confirmed.
Sources & Methodology
Primary-source standard: Market-moving facts should link to original data releases, regulator notices, company filings or official project announcements whenever available. Secondary reporting is used for additional context, not as a substitute for original evidence.
Page last reviewed: