
Silver is trading at $60.67 on the five-hour chart, approaching a key resistance area at $61.94 as the broader downtrend remains intact. Although improving momentum indicators suggest that buyers are attempting a recovery, the metal remains below its 50-period and 200-period moving averages. The next move may depend on whether buyers can overcome resistance or sellers regain control near the upper boundary of the prevailing downward channel.
Silver Faces Resistance at $61.94
Silver prices (XAG/USD) have rebounded, lifting the Relative Strength Index (RSI) to 49, placing momentum near neutral territory. The Moving Average Convergence Divergence (MACD) indicator has also turned positive during the recovery, suggesting that near-term selling pressure has eased.
However, these signals do not yet confirm a sustained reversal. Silver remains below its 50-period moving average at $61.33 and its 200-period average at $65.11. Both levels indicate that the market continues to face overhead pressure.
The metal has been moving within a descending channel since reaching $71.16. That decline keeps the broader technical structure bearish, even as short-term buyers attempt to establish a recovery.
The immediate resistance zone includes several overlapping technical levels:
- $61.94: SuperTrend resistance that could limit the rebound.
- $61.66: The 23.6% Fibonacci retracement level, a potential barrier during a recovery.
- $62.00: Previous swing resistance where selling pressure may return.
A sustained move above this cluster would improve the near-term outlook, but confirmation would still be needed to establish a broader trend reversal.
Key Support Shapes the Next Move
Silver is also approaching the bearish side of the Ichimoku Cloud, a technical indicator used to assess trend direction and potential support or resistance. The cloud adds another obstacle to a recovery, particularly while prices remain below the longer-term moving average.
The $60.00–$61.00 area may continue to produce choppy trading as buyers and sellers test the market’s direction. A decisive breakout, supported by stronger trading volume, would provide a clearer signal than a brief move above resistance.
For traders monitoring the next move, the main levels are:
- $59.50: Potential support for another recovery attempt.
- $58.73: A downside threshold that would weaken the bullish scenario.
- $62.45: A level above which bearish positions could face renewed pressure.
These are technical reference points rather than guaranteed turning points.
Bullish and Bearish Scenarios
The bearish case remains stronger while Silver trades below its moving averages and the $61.94 SuperTrend barrier. A rejection between $61.33 and $61.94 could expose the $59.50 support area, with further losses possible if selling accelerates.
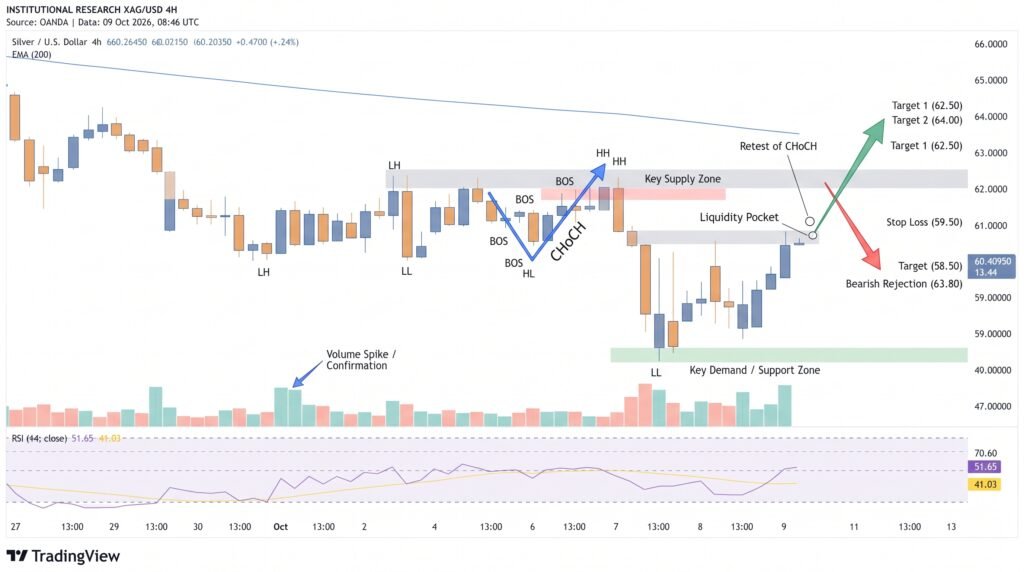
The bullish scenario requires stronger evidence. Buyers would need to defend support, sustain momentum and push above $61.94 with convincing volume. A move through $62.45 would further challenge the bearish outlook, although the broader downtrend would remain relevant.
Conclusion
Silver’s recovery is showing early signs of improving momentum, but the price structure still favors caution. Resistance between $61.33 and $61.94 remains the immediate test, while $59.50 and $58.73 are important downside reference levels. A sustained breakout or breakdown, supported by price action and volume, should provide a more reliable directional signal than short-term indicator changes alone.
Sources & Methodology
Primary-source standard: Market-moving facts should link to original data releases, regulator notices, company filings or official project announcements whenever available. Secondary reporting is used for additional context, not as a substitute for original evidence.
Page last reviewed: