Quick Answer
A moving average is a chart overlay that smooths past price data into a continuously updated line. A Simple Moving Average (SMA) gives every price in its lookback window equal weight. An Exponential Moving Average (EMA) gives more weight to recent prices, so it usually reacts faster. Traders use moving averages to describe trend direction, filter setups, compare short- and long-term momentum, and mark dynamic reference areas. They are lagging indicators because every value is calculated from prices that have already occurred. There is no single best moving average or period for forex. The useful setting is the one that matches the instrument, timeframe, rule and tested purpose.
What Is a Moving Average in Forex?
A moving average takes a selected price series, usually closing prices, and summarizes a recent window of that data. When a new candle closes, the calculation updates and the line moves forward. The result is a smoother representation of price than the raw candle sequence.
Moving averages are most useful when treated as backward-looking trend and regime tools rather than forecasting machines. A longer lookback is smoother but does not automatically create a more reliable signal, while a shorter lookback reacts faster but captures more noise. In spot forex, trading runs continuously through the business week rather than seven days a week, so the period and chart timeframe should match the actual trading horizon.
In my own chart work, I rarely ask whether price is simply above or below one moving average. What catches my attention is the combination of slope, price structure, alignment between several averages, and whether the averages are expanding or becoming tangled. Those details tell me much more about the market regime than one isolated crossover.
Why Do Traders Use Moving Averages?
Trend context
A rising average with price generally holding above it can support an uptrend description. A falling average with price below it can support a downtrend description.
Noise reduction
Smoothing makes the broader direction easier to see when individual candles are volatile.
Regime filtering
A longer average can separate trend-following conditions from periods where price is repeatedly crossing back and forth.
Dynamic reference areas
In an established trend, traders may watch a moving average as a potential pullback area, but the average itself does not guarantee support or resistance.
Objective rules
Crossovers, slope and price position can be converted into testable conditions instead of subjective visual impressions.
Indicator building block
MACD is derived from exponential moving averages, while the middle line of a standard Bollinger Band setup is commonly a moving average.
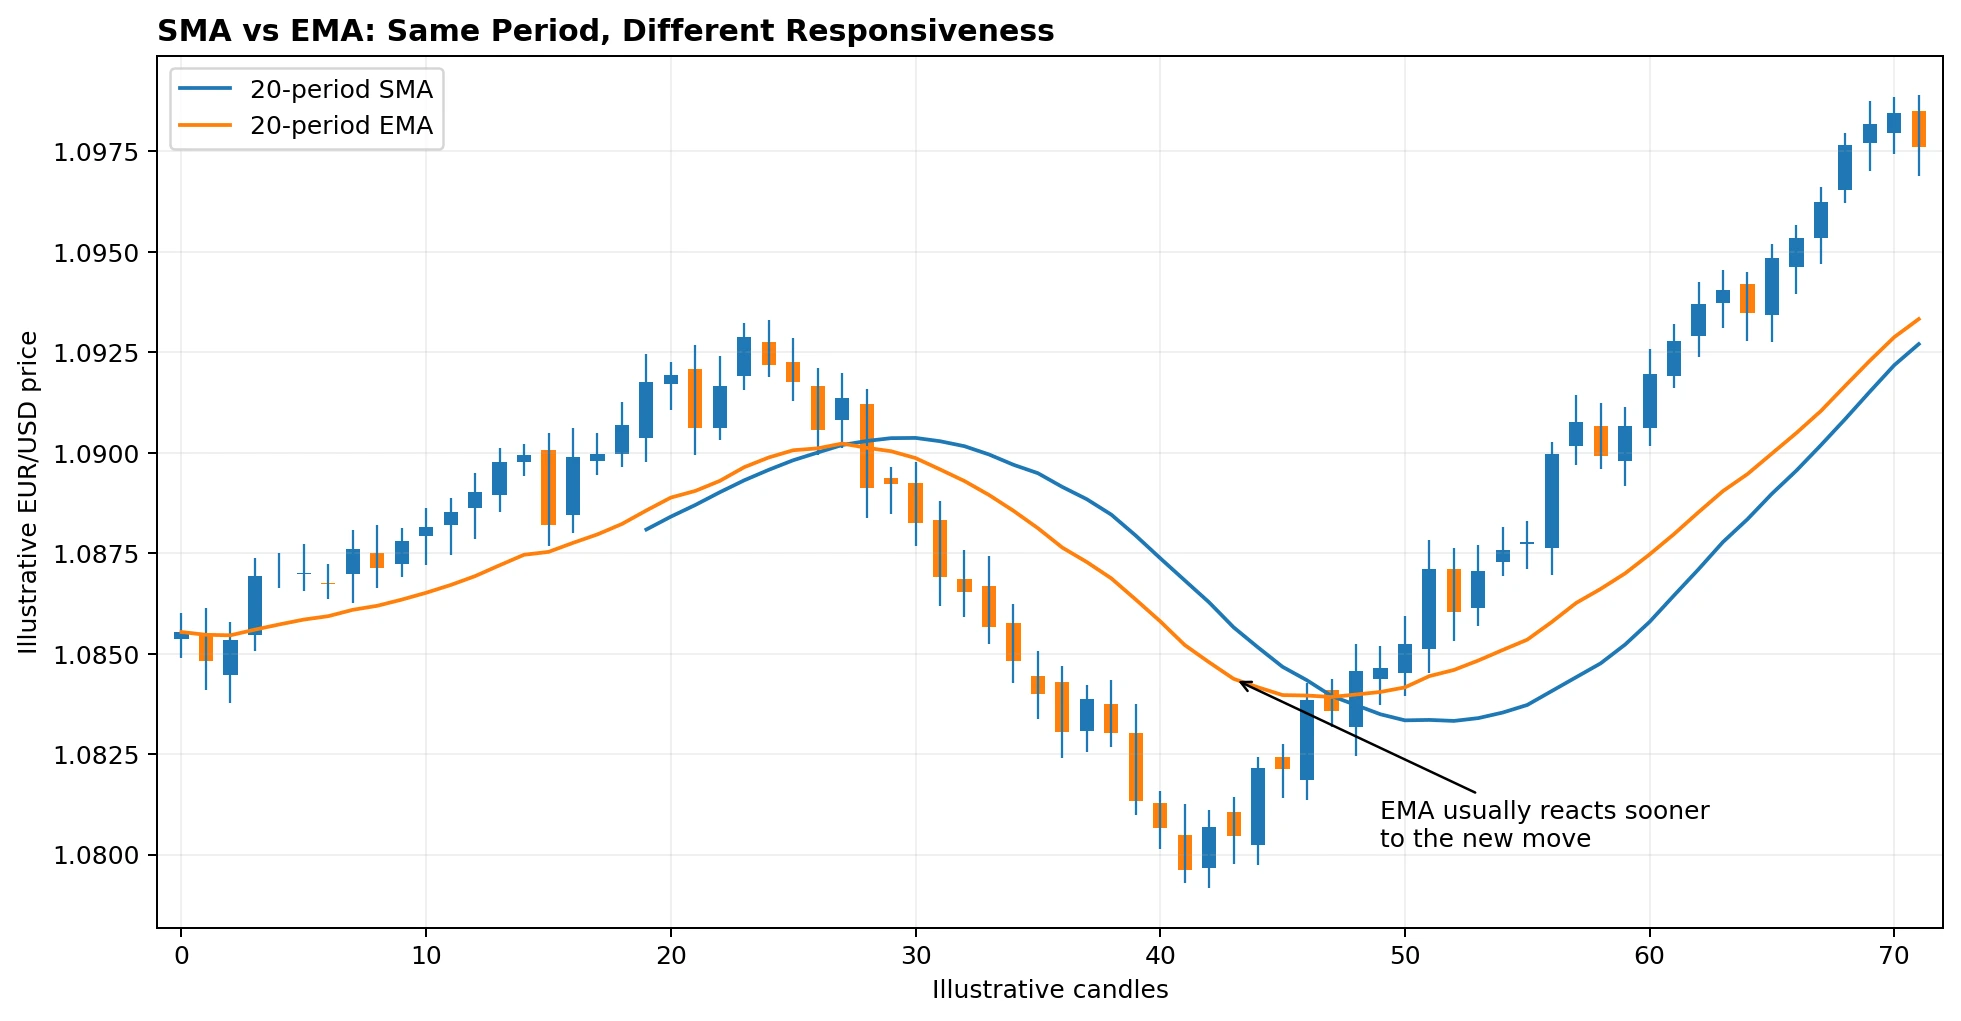
The EMA generally reacts faster than an SMA of the same period because recent prices receive more weight. Faster response can also mean more sensitivity to short-lived noise.
How Are Moving Averages Calculated?
Most charting platforms calculate moving averages automatically, but understanding the math prevents common interpretation errors.
Simple Moving Average (SMA)
The SMA is the arithmetic mean of the selected prices over the last N periods. Every observation receives equal weight.
SMA = (P1 + P2 + … + PN) / N
Example: suppose the last five EUR/USD closes are 1.1000, 1.1010, 1.1020, 1.1015 and 1.1030. Their sum is 5.5075. Dividing by five gives a 5-period SMA of 1.1015. When the next candle closes, the oldest observation leaves the window and the newest one enters.
Exponential Moving Average (EMA)
The EMA also averages price, but it places more weight on newer data. A common smoothing factor is:
Alpha = 2 / (N + 1)
EMA today = (Price today x Alpha) + [EMA yesterday x (1 – Alpha)]
For a 5-period EMA, alpha is 2 / 6, or about 0.333. If yesterday's EMA was 1.1010 and the new close is 1.1040, the new EMA is approximately 1.1020. The exact starting seed can vary by platform, so small differences may appear at the beginning of a data series.
Weighted Moving Average (WMA)
A linearly weighted moving average assigns progressively larger weights to more recent observations. A three-period WMA might weight the oldest price by 1, the next by 2 and the newest by 3.
WMA = Sum(Price x Weight) / Sum(Weights)
WMA is less common in retail forex education than SMA or EMA, but it can be useful when a strategy needs a specific linear weighting rule. It should be tested separately rather than assumed to be better or worse than an EMA.
SMA vs EMA vs WMA: What Is the Difference?
| Type | Weighting | Typical behavior | Main trade-off |
|---|---|---|---|
| SMA | Equal weight to all N prices. | Smoother and slower to react than an EMA of the same period. | Simple and stable, but can turn later. |
| EMA | Exponentially more weight on recent prices. | Usually turns faster after new movement. | More responsive, but also more sensitive to short-term noise. |
| WMA | Predetermined weights, often linear. | Can emphasize the newest observations strongly. | Flexible, but less standardized across strategies. |
No method is universally superior. The formula should match the job assigned to the indicator and remain fixed during testing.
What Does the Moving-Average Period Mean?
The period is measured in chart bars, not automatically in days. A 50-period SMA on a 1-hour chart averages 50 hourly candles; on a daily chart it averages 50 daily candles. For an EMA, the period sets the smoothing factor, and older prices retain progressively smaller weights rather than dropping out after exactly 50 bars. This distinction matters because the same setting measures completely different horizons on different timeframes.
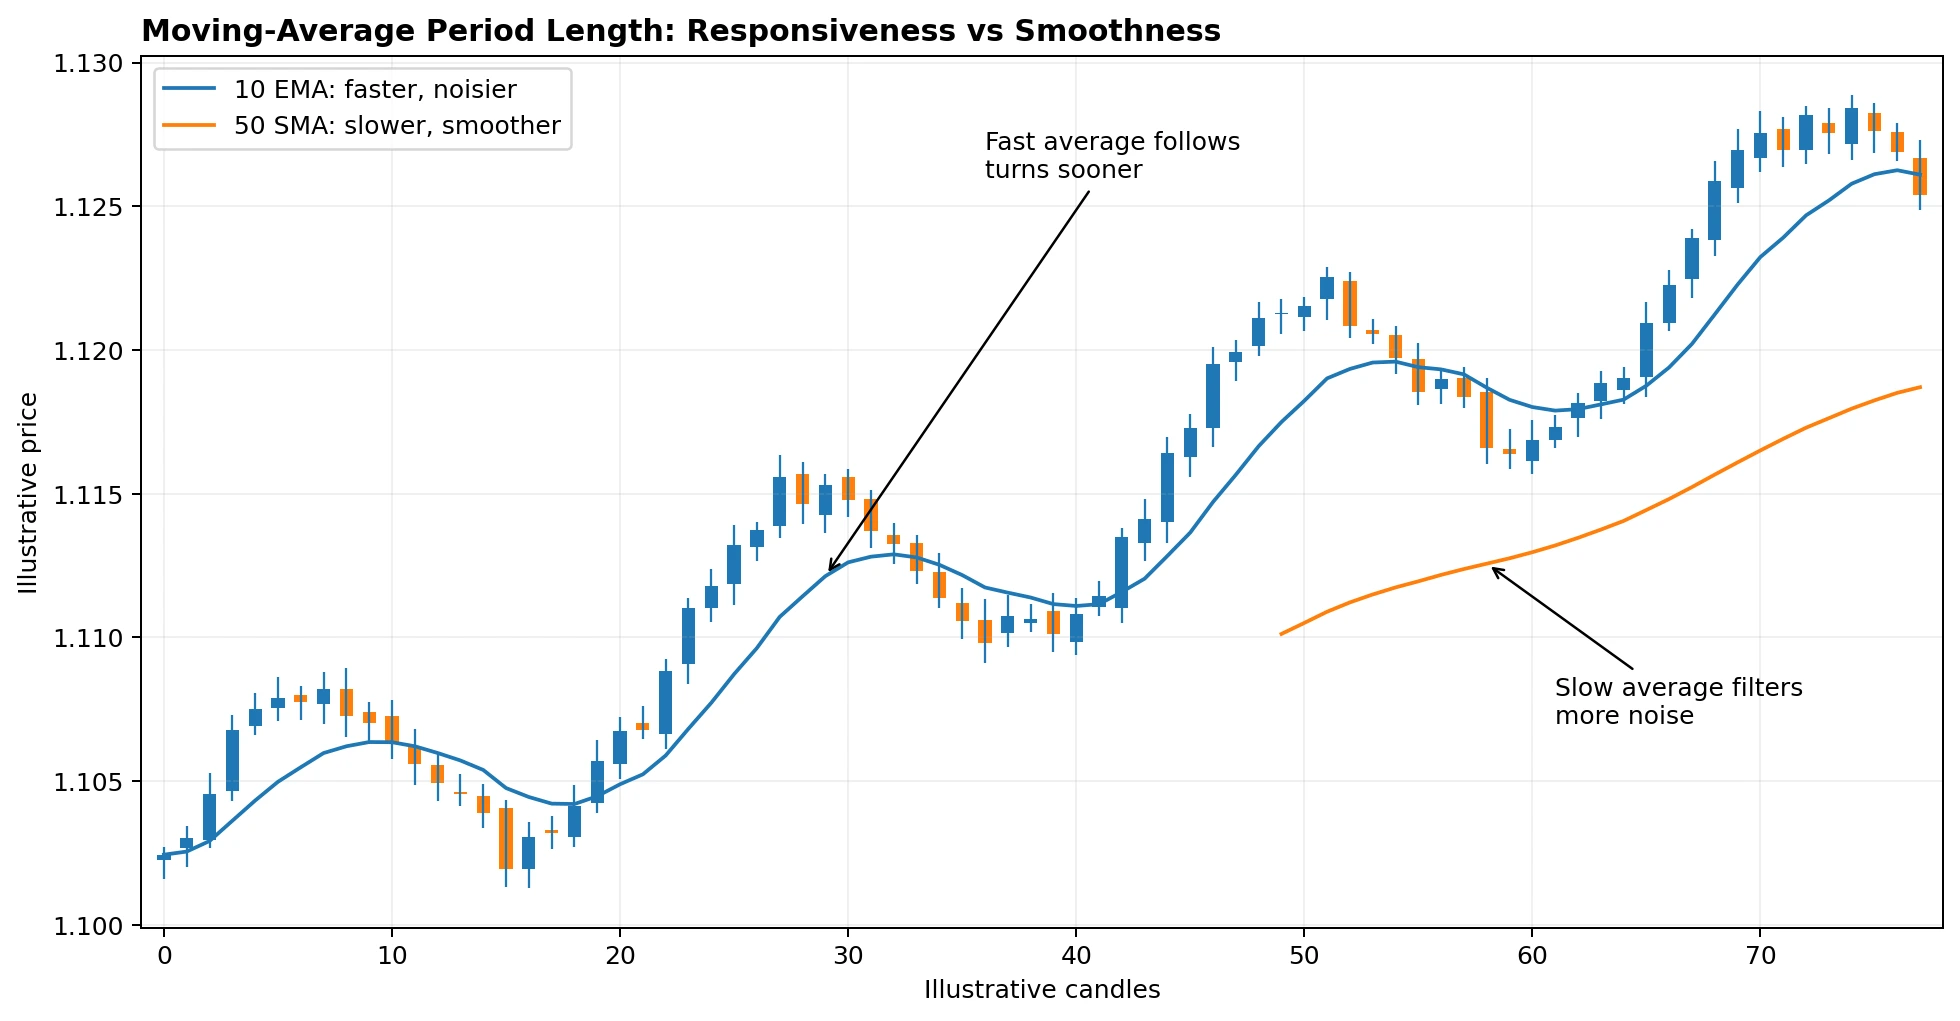
A shorter average follows price more closely and can turn sooner. A longer average is smoother but responds later. The trade-off is responsiveness versus noise filtering.
What Are the Most Common Moving-Average Periods?
Current forex guides and charting practice frequently reference periods such as 10 or 20 for short-term context, 50 for intermediate trend structure, 100 as another medium-to-long reference, and 200 for a broad regime filter. These numbers are conventions, not mathematically optimal settings.
| Period | Common interpretation | Where it may be useful | Caveat |
|---|---|---|---|
| 10-20 | Fast / short-term average. | Short-term trend and pullback context. | Can whipsaw heavily in noisy markets. |
| 50 | Intermediate average. | Swing trend filter; classic component of the 50/200 cross. | Still lags and can be crossed repeatedly in ranges. |
| 100 | Medium-to-long reference. | Additional regime context. | Popularity varies by market and strategy. |
| 200 | Longer-term regime filter. | Broad trend context and classic golden/death cross. | Very slow; by design it confirms late. |
The best period is not the one that produced the cleanest historical chart. Repeatedly changing the period until past results look perfect can create curve fitting and weak out-of-sample performance.
How to Read Moving Averages for Trend Analysis
A moving average is most informative when several observations point in the same direction.
- Price position: price generally above the average supports bullish recent context; price below supports bearish recent context.
- Slope: a rising average confirms that the underlying lookback window has been moving higher; a falling slope shows the opposite.
- Alignment: shorter averages above longer averages can describe bullish stacking, while the reverse can describe bearish stacking.
- Separation: widening distance between averages can show directional expansion; compression can warn that momentum is losing consistency.
- Price structure: higher highs and higher lows matter more than an average line by itself.
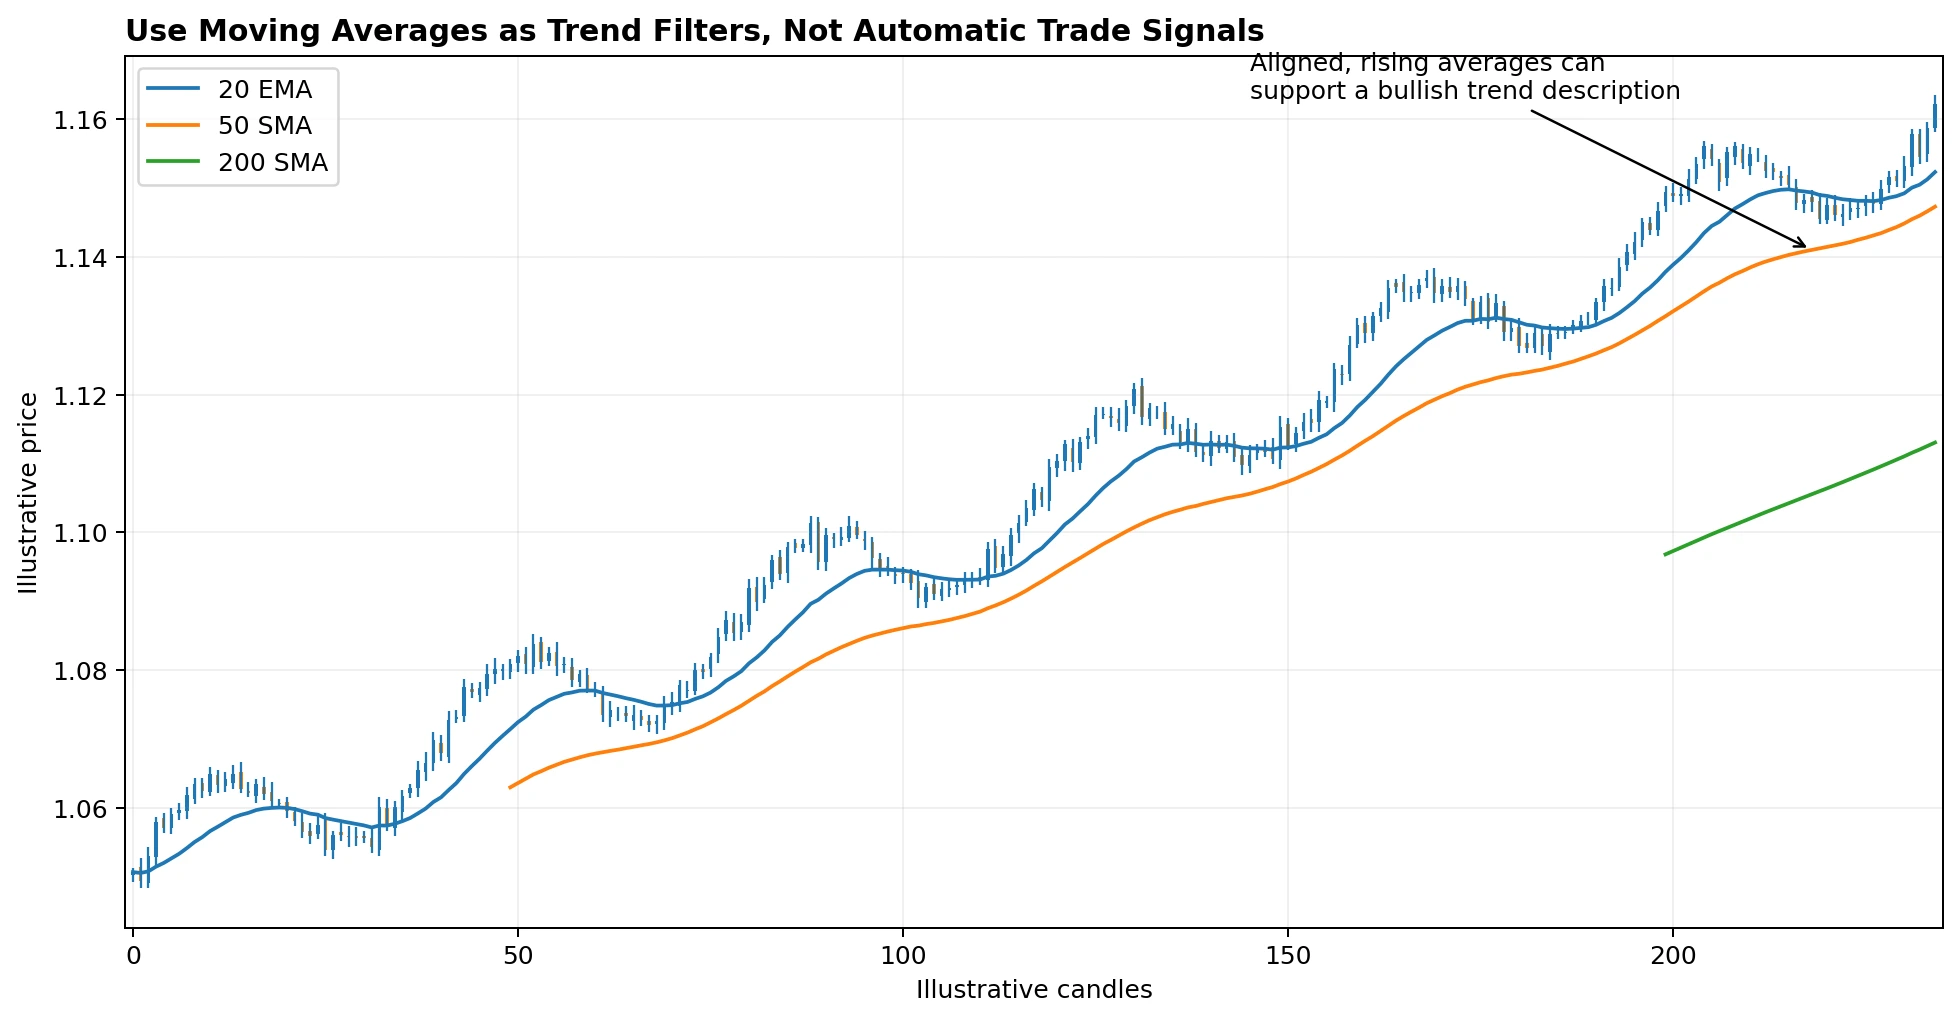
Rising, aligned averages can help describe a bullish regime. The setup is strongest when the moving averages agree with actual price structure instead of replacing it.
Can a Moving Average Act as Support or Resistance?
It can act as a dynamic reference area, especially when price is already trending and repeatedly pulls back toward the same average. The word dynamic matters because the line changes with every new candle. Unlike a horizontal support level, the average is derived from price rather than a fixed historical turning point.
A bounce from a moving average should not be treated as confirmation by itself. Price can react near an average because the broader trend is healthy, because horizontal support is nearby, or simply by coincidence. I prefer to look for confluence with market structure and a completed candlestick reaction before treating a pullback as actionable.
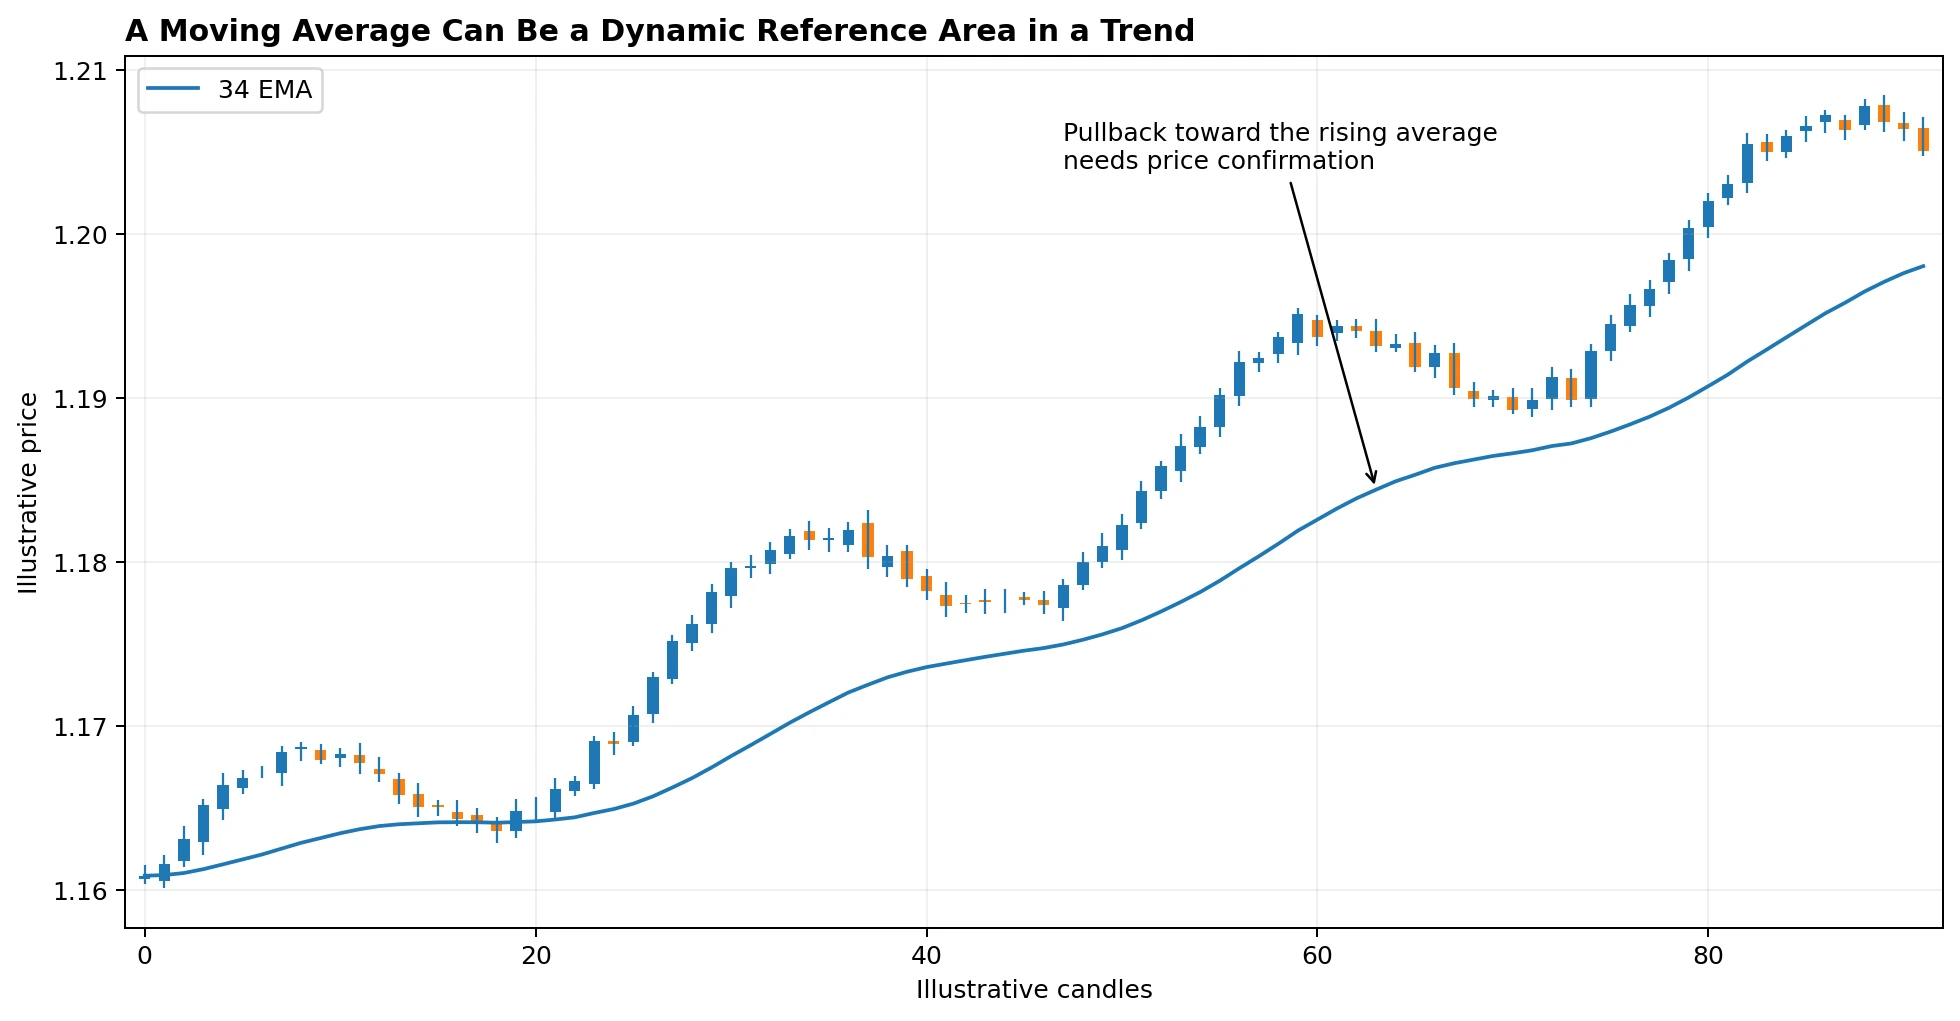
A rising moving average can provide a useful pullback reference in a trend, but the trade still needs price confirmation and a separate invalidation level.
Moving-Average Crossover Strategy
A crossover strategy uses two moving averages with different lookback periods. The shorter or faster average reacts more quickly. The longer or slower average changes more gradually. A bullish crossover occurs when the fast average moves from below to above the slow average. A bearish crossover occurs when the fast average moves from above to below.
Crossovers are objective and easy to test, but they are delayed. Both lines are calculated from past prices, so the market move that causes the crossover has already started before the signal appears. That makes a crossover more useful as a trend or regime condition than as proof that a new move is about to begin.
Golden Cross and Death Cross
The classic golden cross is the 50-day Simple Moving Average crossing above the 200-day SMA. The death cross is the opposite, with the 50-day SMA moving below the 200-day SMA. Fidelity describes these as widely watched bullish and bearish technical signals, but their moving-average construction means they are inherently lagging.
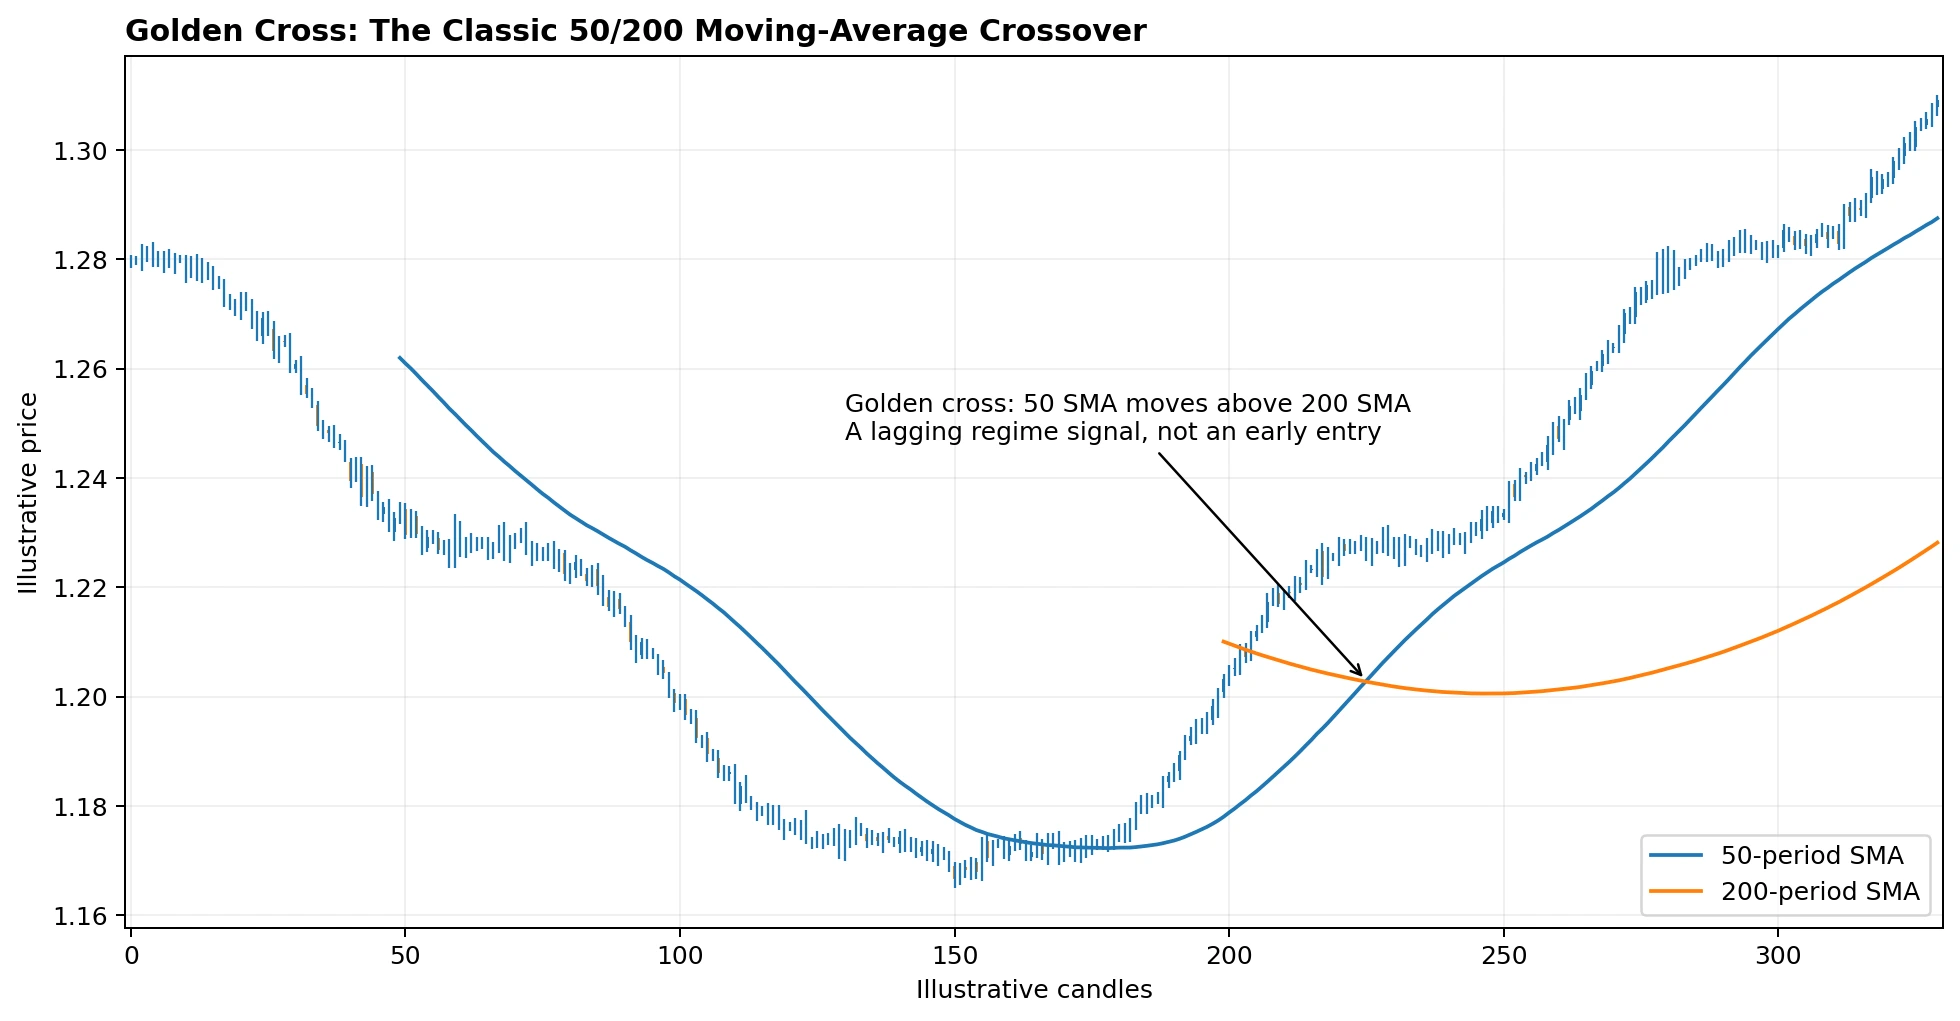
The classic 50/200 golden cross appears only after the shorter average has already been pulled higher by prior price action. It is better treated as a regime confirmation than as an early entry signal.
Forex traders sometimes apply the same idea to other periods and timeframes, but a 20/50 EMA crossover on H1 is not the same setup as a 50/200 SMA golden cross on a daily chart. Each combination is a separate strategy and should be tested separately.
Why Do Moving-Average Crossovers Fail in Sideways Markets?
Moving averages perform best when the market has sustained directional movement. In a range, price repeatedly moves above and below its recent average, causing the fast and slow lines to cross back and forth. This creates whipsaw signals, higher transaction costs and repeated small losses if every crossover is traded.
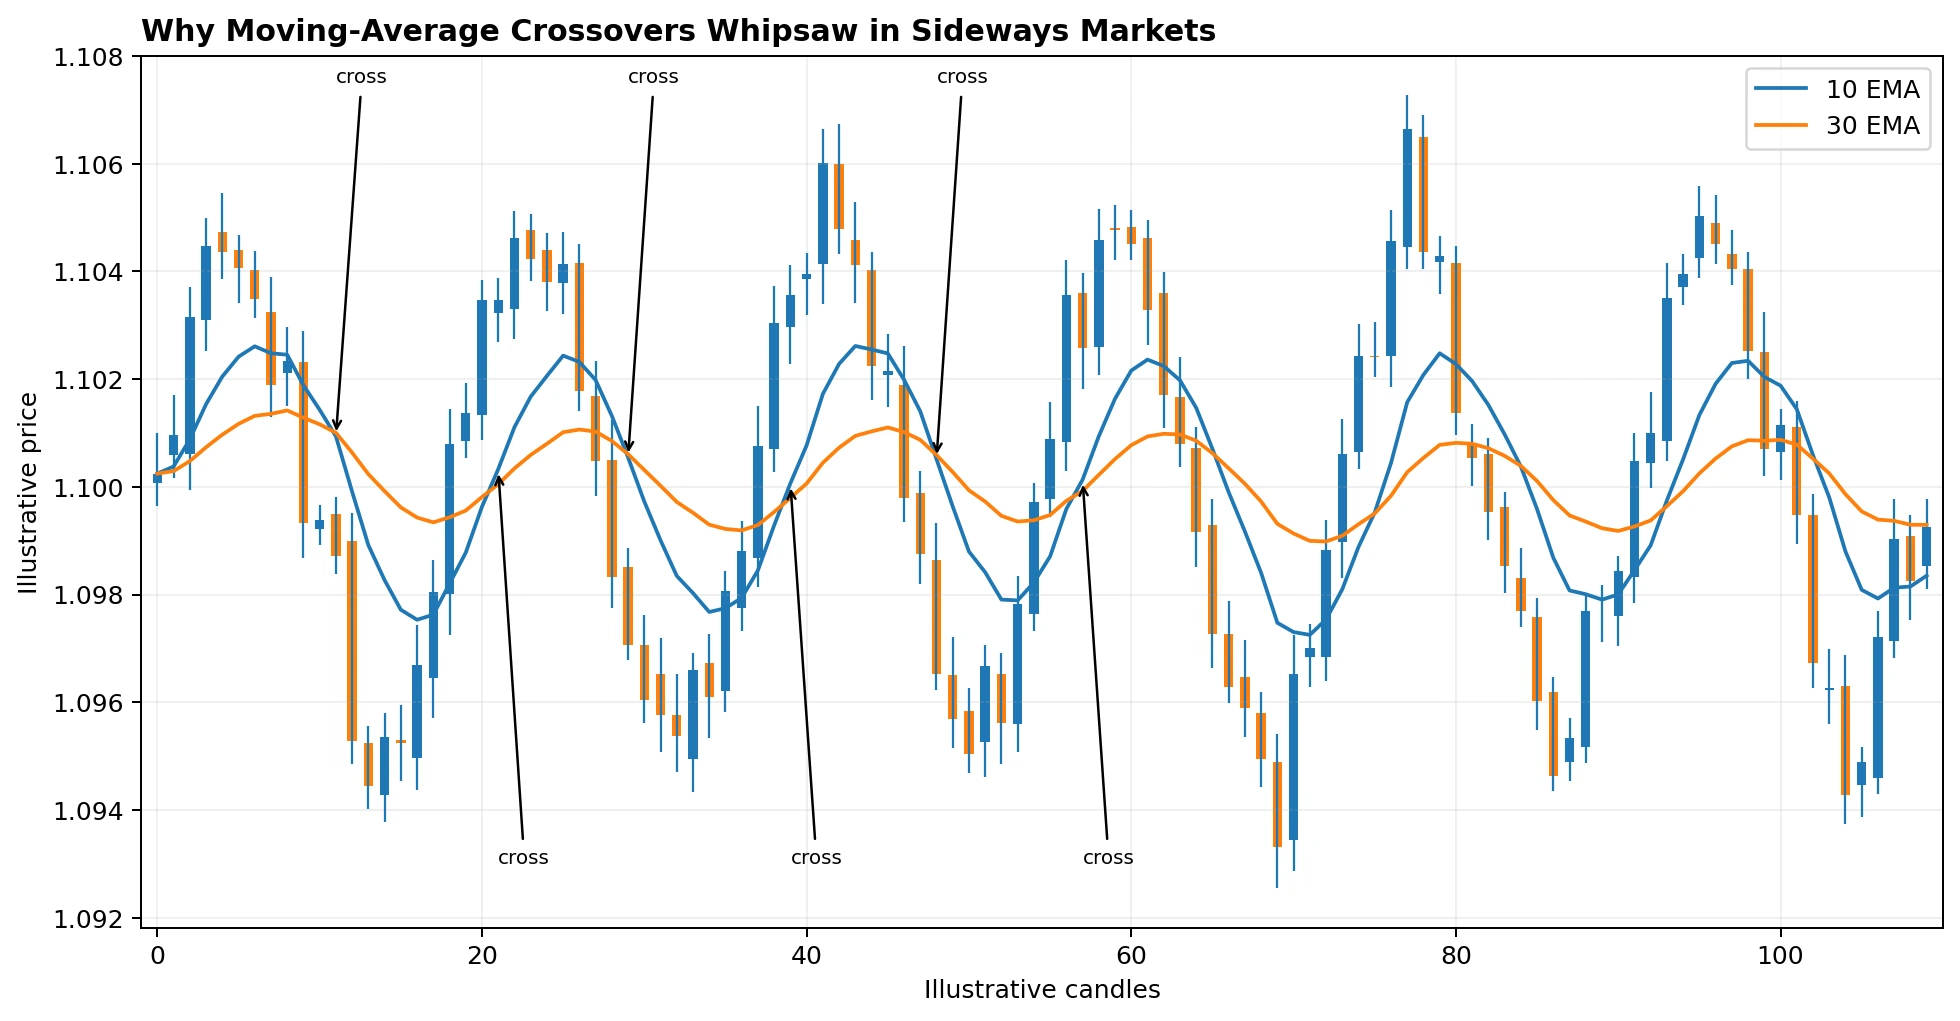
In a sideways market, moving averages can cross repeatedly without a durable trend. A crossover rule needs a regime filter and risk controls to survive this behavior.
A simple filter is to avoid crossover entries when the long average is flat, the averages are tangled, or price is trapped between obvious horizontal support and resistance. Another approach uses ADX or volatility filters, but adding filters can also overfit history. The filter must be tested, not added because it improves one chart.
Four Practical Ways to Use Moving Averages in Forex
1. Trend Filter Strategy
Give the moving average one job: define the directional regime. A strategy might permit long setups only when price is above a rising 200-period average and short setups only when price is below a falling average. The actual entry can then come from support/resistance, a candlestick pattern or another independent rule.
2. Pullback to a Moving Average
In an established trend, price often moves away from its average and later retraces. A pullback strategy waits for price to return toward a chosen average, then requires evidence that the trend is resuming. The stop belongs beyond technical invalidation, not automatically a fixed number of pips from the moving average.
3. Fast/Slow Crossover
A faster moving average crossing a slower one can define a change in trend state. The strategy becomes more robust when the rule also specifies market regime, entry timing, stop placement, spread limits and how to handle a crossover that reverses shortly after entry.
4. Moving-Average Ribbon
A ribbon plots several moving averages on the same chart. Bullish stacking occurs when shorter averages sit above longer averages and the group expands. Compression or tangled lines can signal a less directional market. For broader context on ribbons and other trend tools, the AAFX.io Forex Technical Analysis guide can be used alongside this page; here, the ribbon is treated as a regime visualization rather than a guaranteed entry system.
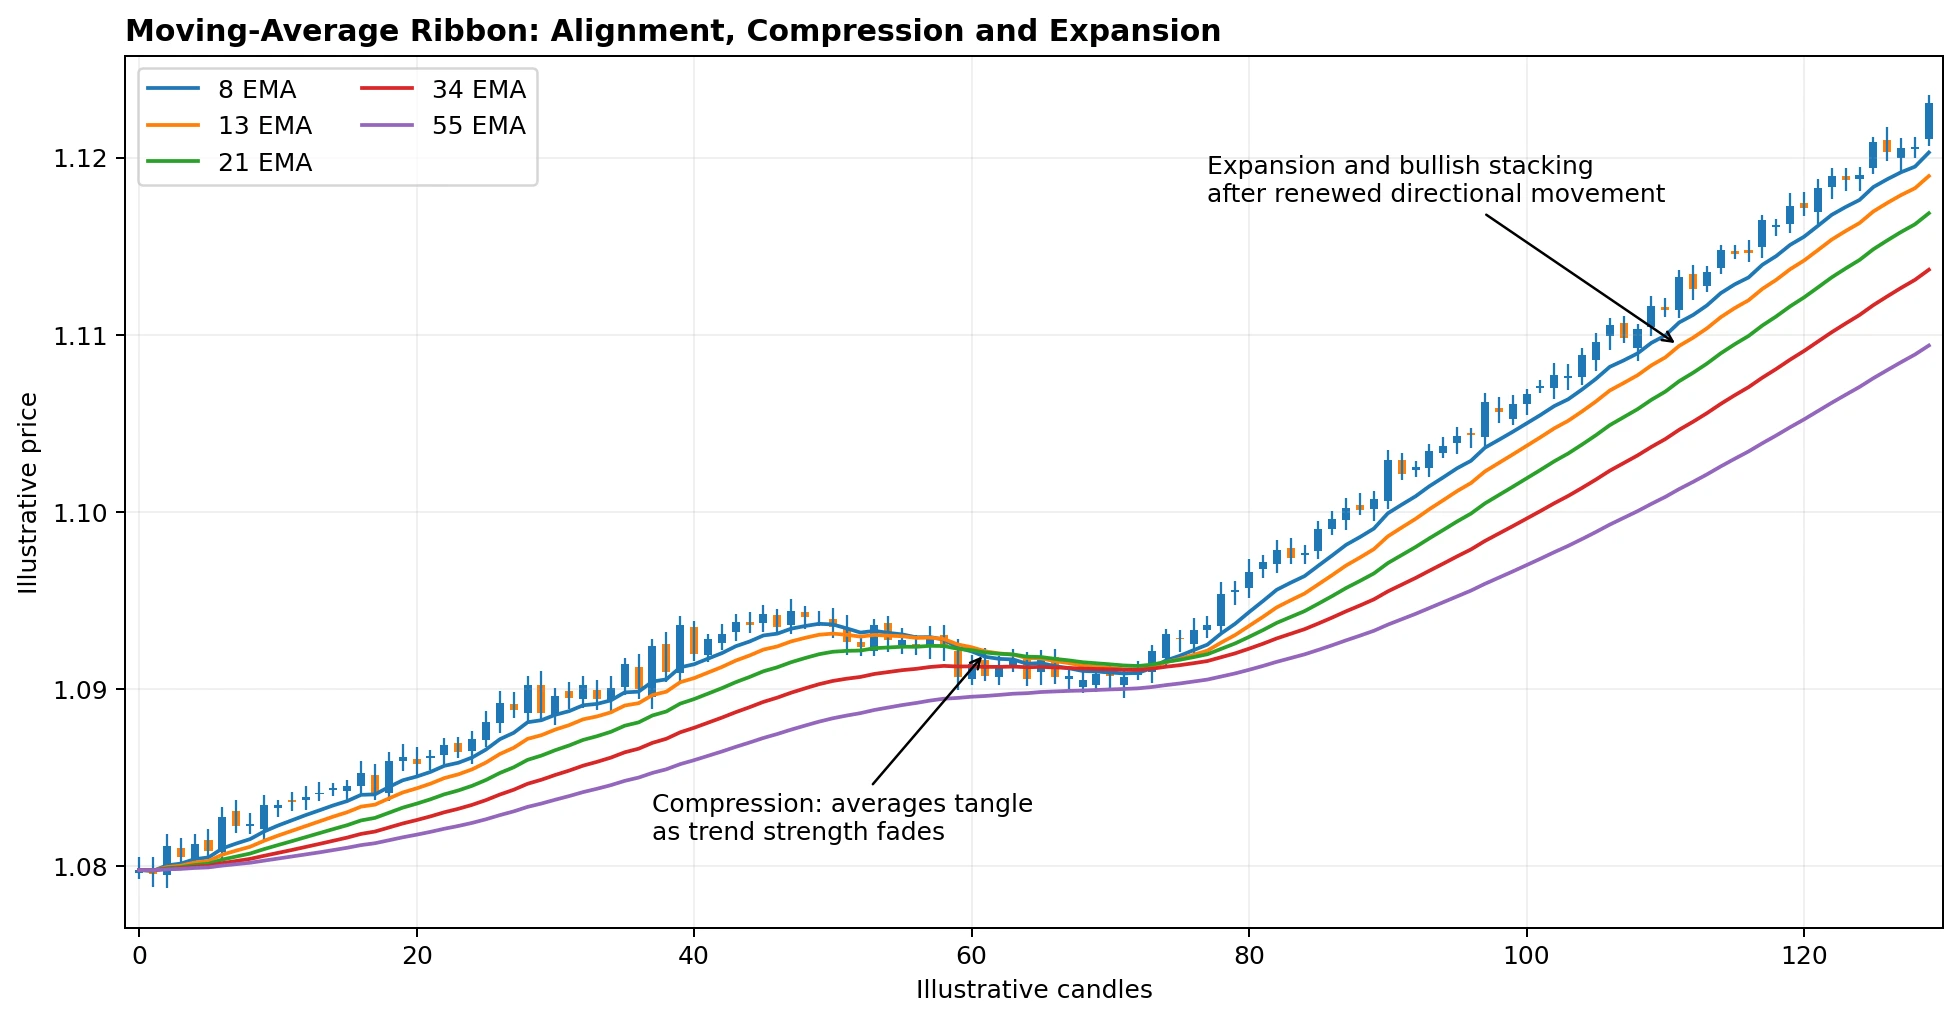
A moving-average ribbon can make trend alignment and compression easier to see. Expansion reflects stronger directional separation; compression shows that the averages are converging.
How to Combine Moving Averages With Other Analysis
Moving averages work best when they answer a different question from the other tool. Combining several indicators that are all derived from the same price series can create the illusion of confirmation without adding much independent information.
| Tool | Useful combination | What to avoid |
|---|---|---|
| Support and resistance | Use the MA as trend context and horizontal levels for location. | Calling an MA touch a support signal without price structure. |
| Candlesticks | Use a completed rejection or continuation candle as the trigger near a trend-aligned average. | Entering before the candle closes if the rule requires completed candles. |
| RSI | Use RSI for momentum context while the MA defines trend direction. | Treating RSI 70/30 as automatic reversal signals. |
| MACD | Understand that MACD is built from EMAs and therefore overlaps with MA information. | Counting a MACD cross plus EMA cross as fully independent confirmation. |
| Bollinger Bands | Use the middle average plus band width to distinguish trend and volatility behavior. | Assuming a touch of the outer band means reversal. |
Moving Averages Across Forex Timeframes
A 20 EMA on a 5-minute chart and a 20 EMA on a daily chart use the same formula but describe completely different horizons. Shorter timeframes contain more intraday noise, spread effects and news reactions. Higher timeframes have fewer signals and slower changes. The timeframe should match the intended holding period.
| Trading style | How an MA may be used | Main risk |
|---|---|---|
| Intraday | Fast trend filter, pullback reference or crossover condition. | Noise, spreads and repeated false crosses. |
| Swing | Intermediate trend filter and pullback structure. | Overnight gaps, news and holding through regime changes. |
| Position / macro | Longer-period regime filter such as 100 or 200 bars. | Very late signals and large distance to invalidation. |
Which Price Should a Moving Average Use?
Closing price is the most common input, but platforms may allow open, high, low, median, typical or weighted prices. Changing the applied price changes the indicator. If you backtest a 20 EMA on close, do not quietly switch it to typical price later and assume the results are comparable.
For charting and testing resources, see our forex trading tools guide. Check available indicators and testing features in the forex trading platform comparison.
How to Backtest a Moving-Average Strategy
- Define the exact moving-average type, period, applied price and timeframe.
- Define the signal: price cross, fast/slow cross, pullback, slope, ribbon alignment or another condition.
- Define the market-regime filter before the test.
- Include spread, commissions, financing and realistic slippage assumptions.
- Specify entry timing: on candle close, next candle open, limit order or retest.
- Define technical invalidation and position size using the AAFX.io Risk Management framework.
- Test all valid signals, including unattractive and losing examples.
- Use out-of-sample data or walk-forward testing to check whether optimized periods survive beyond the original sample.
Curve fitting is a major risk. If a 37 EMA appears perfect only because it was selected after testing dozens of periods on one currency pair, the apparent edge may be noise. Simpler rules with stable behavior across related samples are generally easier to trust than one perfectly optimized historical setting.
Common Moving-Average Mistakes
Treating the moving average as a prediction
The indicator is built from past prices. It describes trend context; it does not know the next price.
Assuming EMA is always better than SMA
EMA reacts faster, but faster response can also create more noise. The right formula depends on the strategy.
Trading every price cross
Price can cross the average repeatedly in ranges. A cross is a condition, not a complete trade.
Believing 200 is a magic number
The 200-period average is widely watched, but it is still a moving calculation and can fail.
Calling every MA touch support or resistance
A moving average is a dynamic reference. Price structure must confirm whether the area matters.
Using too many averages
Five or ten lines can make a chart look sophisticated while adding little independent information.
Ignoring timeframe
A 50-period MA means 50 bars, not automatically 50 days.
Ignoring news and volatility
A central-bank surprise can overwhelm a clean technical average in seconds.
Using moving averages as the stop themselves
The invalidation level should reflect the setup. The MA can be part of the logic but should not replace risk planning.
Changing settings after every losing streak
Constantly optimizing periods can destroy consistency and make backtests meaningless.
Frequently Asked Questions
What is a moving average in forex?
A moving average is a chart indicator that smooths a selected series of past prices over a set number of bars to make trend direction easier to interpret.
What is the difference between SMA and EMA?
SMA gives every observation in the lookback window equal weight. EMA gives more weight to recent prices, so it usually reacts faster to new movement.
Is EMA better than SMA for forex?
Not universally. EMA is more responsive, while SMA is smoother. The better choice depends on the market, timeframe, strategy and tested purpose.
What is the best moving average for forex?
There is no single best moving average. Common choices include 20, 50, 100 and 200 periods, but the useful setting is the one that fits a clearly defined strategy and performs consistently in testing.
What does a 50-period moving average mean?
A 50-period SMA averages the latest 50 chart bars. On H1 that means 50 hourly candles; on D1 it means 50 daily candles. A 50-period EMA uses that period to set its smoothing factor and retains diminishing influence from older prices.
What is a golden cross?
The classic golden cross occurs when the 50-day SMA crosses above the 200-day SMA. It is commonly interpreted as bullish trend confirmation, but it lags price.
What is a death cross?
The death cross is the opposite: the 50-day SMA crosses below the 200-day SMA. It is a bearish regime signal, not a guarantee of further decline.
Do moving averages act as support and resistance?
They can act as dynamic reference areas in trending markets, but an MA touch does not guarantee a bounce. Price structure and confirmation matter.
Why do moving-average crossovers fail?
They often whipsaw when price is ranging because both averages repeatedly change order without a sustained trend.
Which moving average is best for day trading?
No setting is universally best. Shorter averages react faster and produce more signals, but they also respond to more noise. Test the period on the exact pair and timeframe you intend to trade.
Can moving averages predict forex trends?
No. They are lagging indicators calculated from historical prices. They can describe and confirm trend behavior, but they cannot predict with certainty.
Should I use moving averages with RSI?
They can complement each other if the MA defines trend context and RSI measures momentum. Avoid treating both as independent proof of the same prediction.
Does a moving average work during news events?
The calculation still works, but a major event can move price far faster than a moving average can adapt. Spreads, slippage and volatility can also increase.
How many moving averages should I use?
Use only as many as the strategy needs. One can define trend, two can create a crossover, and several can form a ribbon. More lines are not automatically better.
Moving-Average Checklist Before a Trade
- What job does the moving average have in this strategy: trend filter, pullback reference, crossover condition or exit context?
- Is the average clearly rising or falling, or is it flat and being crossed repeatedly?
- Does price structure agree with the moving-average signal, or are support and resistance pointing the other way?
- Is the market trending, ranging or moving unusually fast after a news event?
- Has the signal candle closed if the strategy requires a completed-bar rule?
- Where is the technical invalidation level, and what position size fits that stop distance?
- Is a central-bank decision, inflation report or employment release close enough to change normal volatility?
- Would the setup still make sense after spread, slippage, commissions and financing are included?
Bottom Line
Moving averages are most useful when they are given one clear job. Use them to smooth price, define trend context, compare short- and long-term momentum, or create a repeatable regime rule. Do not expect the line to predict the future.
The key trade-off is always the same: faster averages react sooner but capture more noise; slower averages are smoother but lag more. SMA, EMA and WMA simply choose different weighting methods. Period selection creates another trade-off between responsiveness and stability.
For AAFX.io, the practical framework is simple: let moving averages describe the trend, use support/resistance and candlestick structure for location and confirmation, and use the Risk Management and Position Sizing guide to define how much can be lost if the setup fails. What would change my trend view is not one tiny cross of the line, but sustained price structure on the other side, a change in slope/alignment, or new fundamental information that changes the market regime.
Editorial Sources
- Fidelity: Simple Moving Average
- Fidelity: Exponential Moving Average
- Fidelity: Moving-Average Signals and Crossovers
Risk warning: Forex and leveraged trading involve substantial risk. Moving averages are lagging indicators and can produce false or late signals, especially in sideways markets. This material is educational and is not personalized financial advice.
Sources & Methodology
Primary-source standard: Market-moving facts should link to original data releases, regulator notices, company filings or official project announcements whenever available. Secondary reporting is used for additional context, not as a substitute for original evidence.
Page last reviewed: