
Brent crude oil is consolidating around $104.11 on the five-hour chart, with buyers defending $102.50 and sellers resisting advances toward $106.00. The narrow range reflects a market struggling to establish a clear direction despite prices remaining above key moving averages. Weak trend strength and declining volume suggest traders lack conviction, increasing the risk of false breakouts. Broader oil-market developments also matter, as traders assess geopolitical risks, supply disruptions and changes in expectations for global crude demand.
Brent Oil Holds a Narrow Range
Brent’s five-hour chart shows the price above its 20-, 50- and 200-period simple moving averages, suggesting the underlying technical structure remains positive. However, that alignment has not translated into a sustained rally, with resistance between $105.00 and $106.00 repeatedly limiting upside progress.
The Moving Average Convergence Divergence (MACD) indicator remains mildly bullish, with its reading at 0.88 compared with a signal line at 0.82. This points to positive momentum, although the difference is too small to establish a decisive trend on its own.
The Ichimoku Cloud places structural support around $100.52–$102.81, keeping the broader chart setup constructive while prices remain above the cloud. Declining trading volume, however, suggests buyers are not yet committing enough capital to force a breakout.
Weak ADX Raises False-Breakout Risk
The key warning comes from the Average Directional Index (ADX), which stands at just 10.72. ADX measures trend strength rather than direction, and readings below 20 are commonly associated with weak or range-bound conditions. At current levels, neither buyers nor sellers have demonstrated sustained control.
Repeated upper wicks near $105.00–$106.00 indicate selling pressure at the top of the range, while rebounds around $102.50 show that buyers continue to defend support. This pattern can encourage premature entries as prices briefly move beyond familiar levels before returning inside the range.
Traders should watch for confirmation rather than treating a single candle as proof of a new trend. A stronger move would ideally coincide with rising volume and an ADX recovery toward 20 or higher.
Brent Oil Forecast: Key Levels Ahead
The immediate outlook depends on whether Brent can break out of its established trading band. Until that happens, the middle of the range offers limited directional clarity.
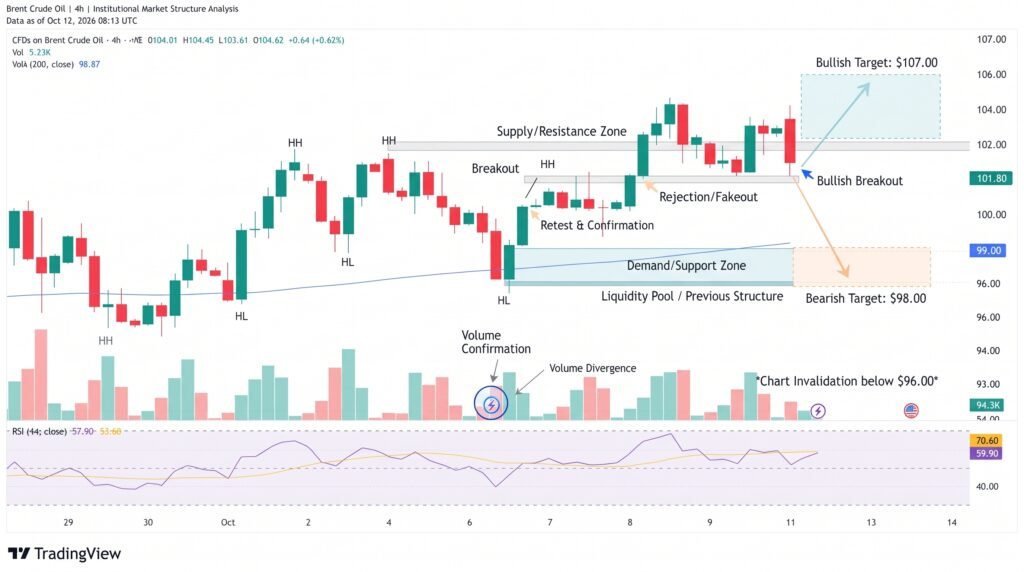
Key levels to monitor include:
- Resistance: $105.00–$106.00. A sustained five-hour close above $106.00 would strengthen the bullish case.
- Support: $102.50. A confirmed close below this level would increase downside risk.
- Cloud support: $100.52–$102.81, a broader technical area to watch if selling pressure intensifies.
- No-trade zone: $103.50–$104.50, where price is vulnerable to choppy movements and false signals.
Conclusion
Brent’s near-term direction remains uncertain. A confirmed break above $106.00 could restore bullish momentum, while a move below $102.50 would shift attention toward lower support. Until price escapes the range with stronger volume and improving trend strength, patience and disciplined risk management offer a more defensible approach than chasing short-term price swings. Traders should also monitor broader crude oil market developments, since supply disruptions and changes in demand expectations can quickly alter the technical outlook.
Sources & Methodology
Primary-source standard: Market-moving facts should link to original data releases, regulator notices, company filings or official project announcements whenever available. Secondary reporting is used for additional context, not as a substitute for original evidence.
Page last reviewed: