
West Texas Intermediate (WTI) crude oil has entered deeply oversold territory, with its Relative Strength Index (RSI) falling to 19.42 as prices slide toward $87.10. The sharp decline reflects intense selling pressure, reinforced by bearish momentum indicators and a completed double-top breakdown near $96. However, extreme oversold conditions raise the possibility of a short-covering rebound. The next major test is whether buyers can defend $87.10 or whether selling pushes WTI toward the $83 support area.
WTI Oil Faces Intense Selling Pressure
WTI is trading below its 20-day, 50-day and 200-day simple moving averages, a bearish alignment that signals weakness across short-, medium- and long-term trends. The price also sits approximately 9.25% below its 20-day average, highlighting the speed of the recent decline.
The Relative Strength Index at 19.42 is well below the traditional oversold threshold of 30. This indicates that selling has been unusually aggressive, although an oversold reading does not automatically signal that prices have reached a bottom.
The MACD indicator reinforces the negative outlook. Its reading of -3.32 remains below the signal line at -2.19, indicating that downward momentum is still dominant. Meanwhile, the SuperTrend indicator continues to generate a bearish signal.
The Average Directional Index (ADX) stands at 41.94, while the positive directional indicator is just 9.16. This combination suggests a strong trend in which sellers have a clear advantage.
$83 Support Becomes the Next Target
The technical breakdown began after WTI failed to hold the $96 area, completing a double-top pattern. This formation typically signals a bearish reversal when prices break below the support separating two price peaks.
The November 4 bearish Marubozu candle near $92.09 also reflected strong selling conviction. A Marubozu is a candlestick with little or no wick, indicating that one side of the market dominated during the session.
WTI has also broken below the 61.8% Fibonacci retracement at $88.08, calculated from the $76.53-$106.75 price range. The next major retracement level is $83.00, corresponding to 78.6%.
Key technical levels include:
- Immediate support: $87.10.
- Downside target: $83.00-$85.00.
- Resistance zone: $90.00-$92.00.
- Major resistance: $96.00.
- Bullish invalidation: $92.00.
- Bearish invalidation: $85.00.
The Average True Range (ATR) of $2.08, or approximately 2.39%, also indicates substantial daily price movement.
Crude Oil Forecast: Rebound or Breakdown?
Despite the bearish structure, WTI’s oversold RSI and position near the lower Bollinger Band at $85.69 increase the risk of a temporary rebound. Traders who have accumulated short positions may buy back contracts to secure profits, creating additional upward pressure.
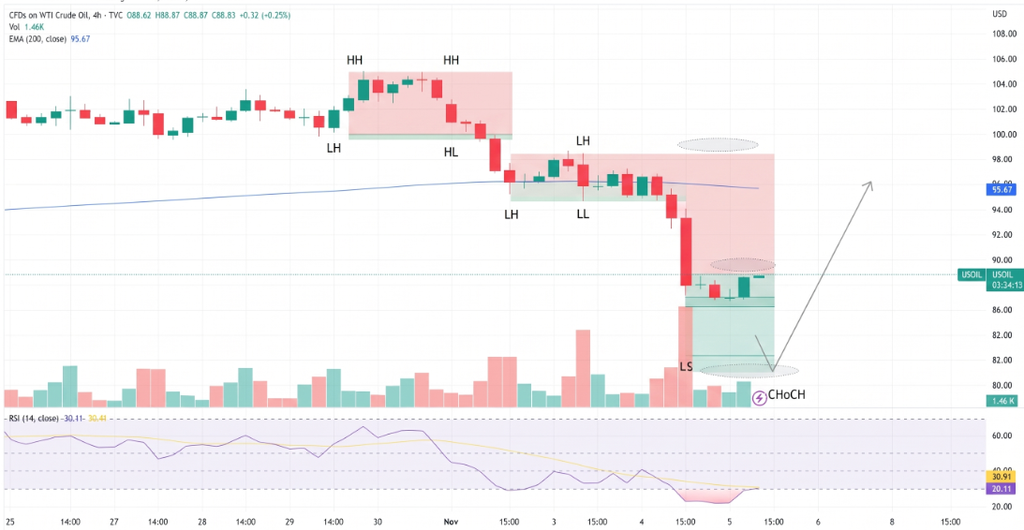
A recovery toward $90-$92 could provide an important test of whether former support has turned into resistance. Failure to reclaim that zone would leave the broader bearish structure intact.
Conversely, a sustained break below $87.10 could expose the $85 area and the deeper $83 Fibonacci level. A move above $92 would weaken the immediate bearish outlook.
Conclusion
WTI crude oil remains under substantial selling pressure, with its RSI at 19.42 highlighting extreme downside conditions. The completed double-top breakdown and bearish moving-average alignment favor sellers, but the risk of a sharp technical rebound is increasing. A sustained break below $87.10 could accelerate losses toward $83, while a recovery into $90-$92 may offer the next test of bearish strength. Until buyers reclaim resistance, the broader outlook remains negative.
Sources & Methodology
Primary-source standard: Market-moving facts should link to original data releases, regulator notices, company filings or official project announcements whenever available. Secondary reporting is used for additional context, not as a substitute for original evidence.
Page last reviewed: