Quick Answer
Fibonacci retracement is a technical-analysis tool that maps percentage pullbacks between a meaningful swing low and swing high. The most commonly watched levels are 23.6%, 38.2%, 50%, 61.8% and 78.6%. Traders use them as reference zones where a correction may pause, reverse or continue. The 50% level is widely used but is not a Fibonacci ratio. In an uptrend, draw the tool from swing low to swing high; in a downtrend, draw it from swing high to swing low. Fibonacci levels are not automatic buy or sell signals. They become more useful when they align with price structure, support or resistance, moving averages, candlestick confirmation and a defined risk plan.
What Is Fibonacci Retracement in Forex?
Fibonacci retracement divides a completed price swing into percentage levels so traders can judge the depth of a pullback. Unlike a moving average, which changes with every new candle, Fibonacci retracement levels remain fixed until the trader changes the swing anchors.
The tool does not prove that currencies follow a mathematical law. It is better understood as a standardized way to organize pullbacks. A level can become more relevant when it overlaps with something that already matters on the chart, such as a prior swing high, a horizontal support zone, a trendline, a moving average or a completed reversal candle.
In my own technical analysis, the Fibonacci number itself is rarely the reason I like a setup. What catches my attention is the confluence. If a 61.8% retracement sits inside a well-tested support zone and the pullback then prints a convincing bullish reaction, the setup is more interesting than a naked 61.8% line in the middle of nowhere.
Where Do Fibonacci Ratios Come From?
The Fibonacci sequence is a series in which each number is the sum of the two numbers before it: 0, 1, 1, 2, 3, 5, 8, 13, 21, 34, 55 and so on. The sequence is named after Leonardo of Pisa, known as Fibonacci, who described it in Liber Abaci in the early 13th century, although related numerical ideas appeared in earlier mathematics.
As the sequence progresses, dividing one number by the next approaches about 0.618. Dividing by the number two places ahead approaches about 0.382, and dividing by the number three places ahead approaches about 0.236. Those relationships underpin the most familiar retracement ratios.
The Main Fibonacci Retracement Levels
| Level | Where it comes from | Typical interpretation | Important caveat |
|---|---|---|---|
| 23.6% | Approx. one Fibonacci number divided by the number three places ahead. | Shallow retracement during strong momentum. | A shallow pullback can still deepen quickly. |
| 38.2% | Approx. one number divided by the number two places ahead. | Moderate pullback and widely watched reference. | Not automatically weaker or stronger than 50% or 61.8%. |
| 50.0% | Trading convention, not a Fibonacci-derived ratio. | Half retracement of the original swing. | Popular because traders watch it, not because it comes from the Fibonacci sequence. |
| 61.8% | Approx. one Fibonacci number divided by the next. | The classic golden-ratio retracement. | No evidence that price must reverse here. |
| 78.6% | Commonly derived as the square root of 61.8%. | Deep retracement that still remains inside the original swing. | A deep pullback can be close to full invalidation depending on structure. |
Some platforms or traders use 76.4% instead of 78.6%. The 76.4% level is the complement of 23.6%, while 78.6% is derived from the square root of 0.618. Neither should be treated as universally superior. Use the same set of levels consistently if you plan to test a strategy.
How to Draw Fibonacci Retracement Correctly
The quality of the swing anchors matters more than adding extra ratios. Fibonacci retracement works best when the chart has a clear directional leg that other traders could also identify without forcing the analysis.
Uptrend: Draw From Swing Low to Swing High
- Identify a meaningful completed bullish impulse rather than a minor candle-to-candle move.
- Anchor the tool at the swing low where the impulse began.
- Drag it to the swing high where that impulse ended.
- Watch the retracement levels below the high as price pulls back.
- Treat the levels as decision zones and wait for the strategy's confirmation rule.
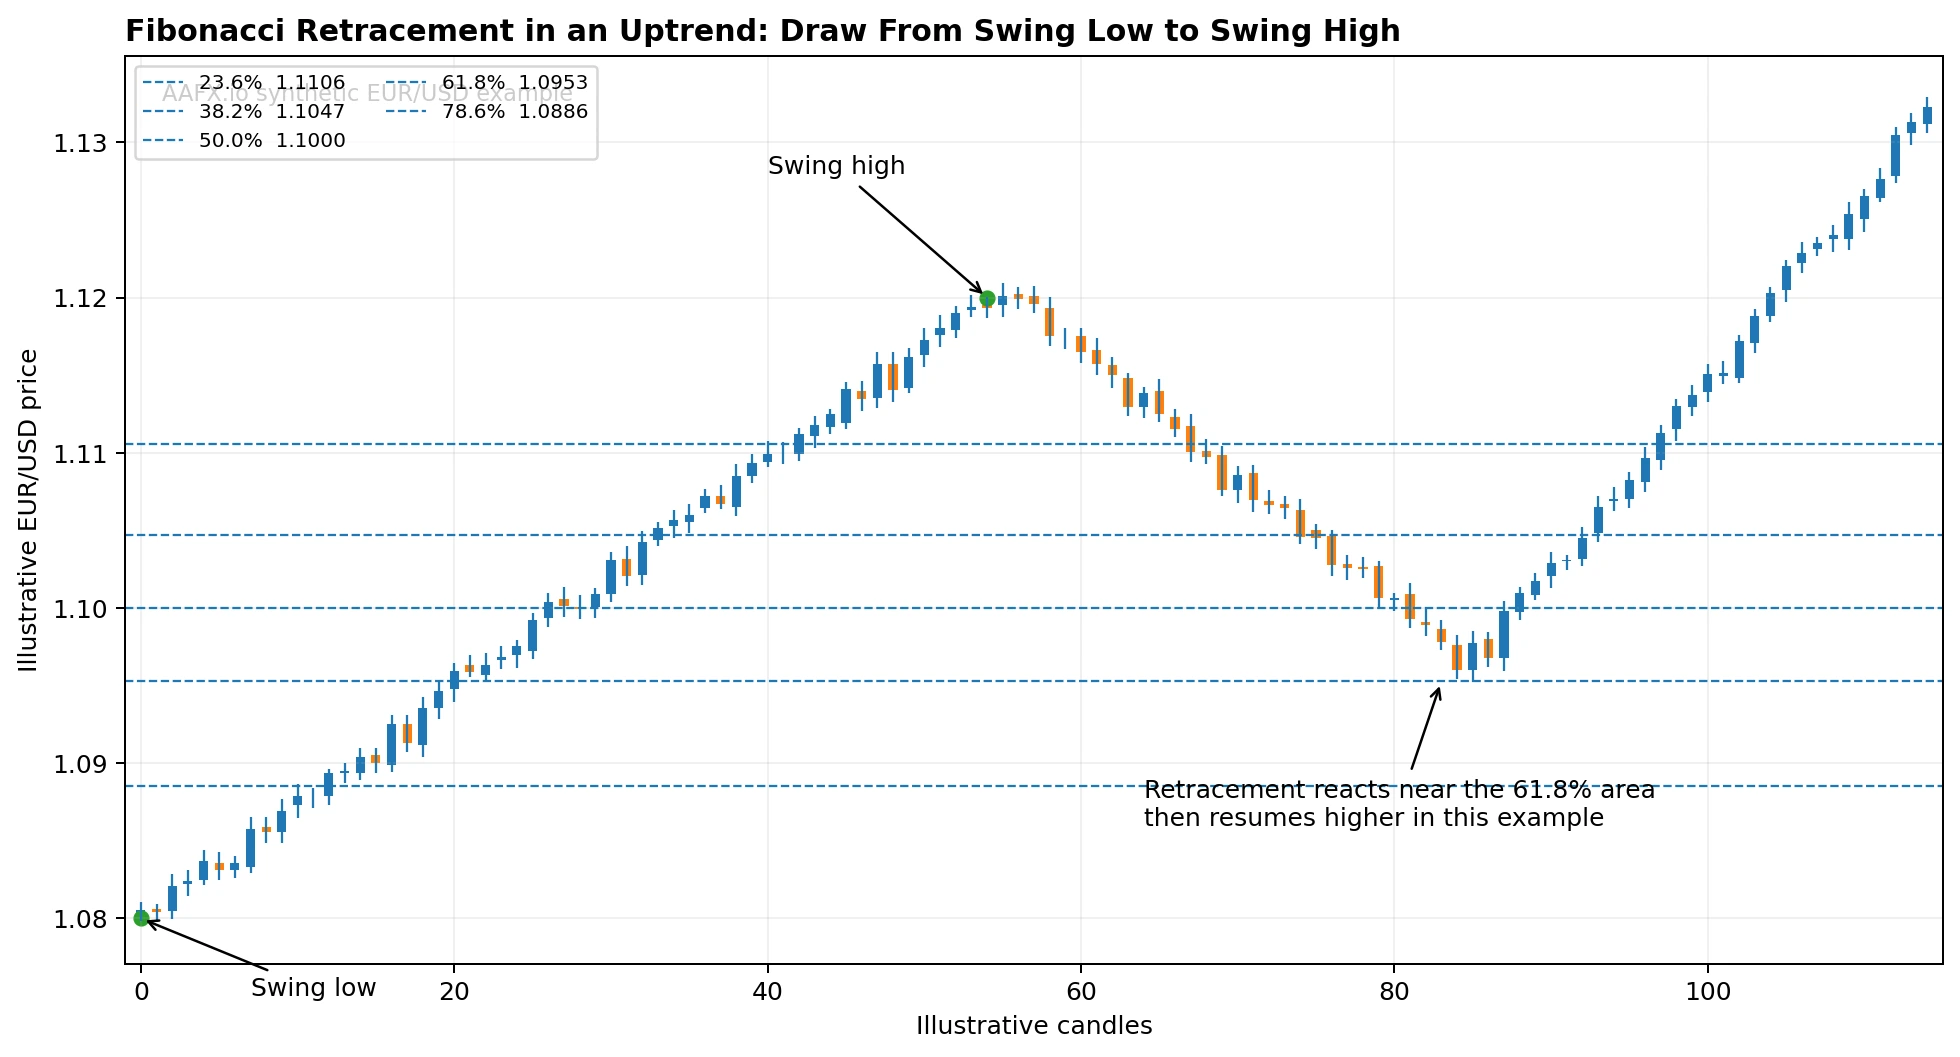
In an uptrend, retracement levels are measured downward from the swing high. The example reacts near the deeper retracement area, but the level itself did not cause the continuation.
Downtrend: Draw From Swing High to Swing Low
- Identify a meaningful bearish impulse.
- Anchor the tool at the swing high where the decline began.
- Drag it to the swing low where the impulse ended.
- Watch the retracement levels above the low as price rebounds.
- Require a bearish confirmation rule before treating a level as resistance.
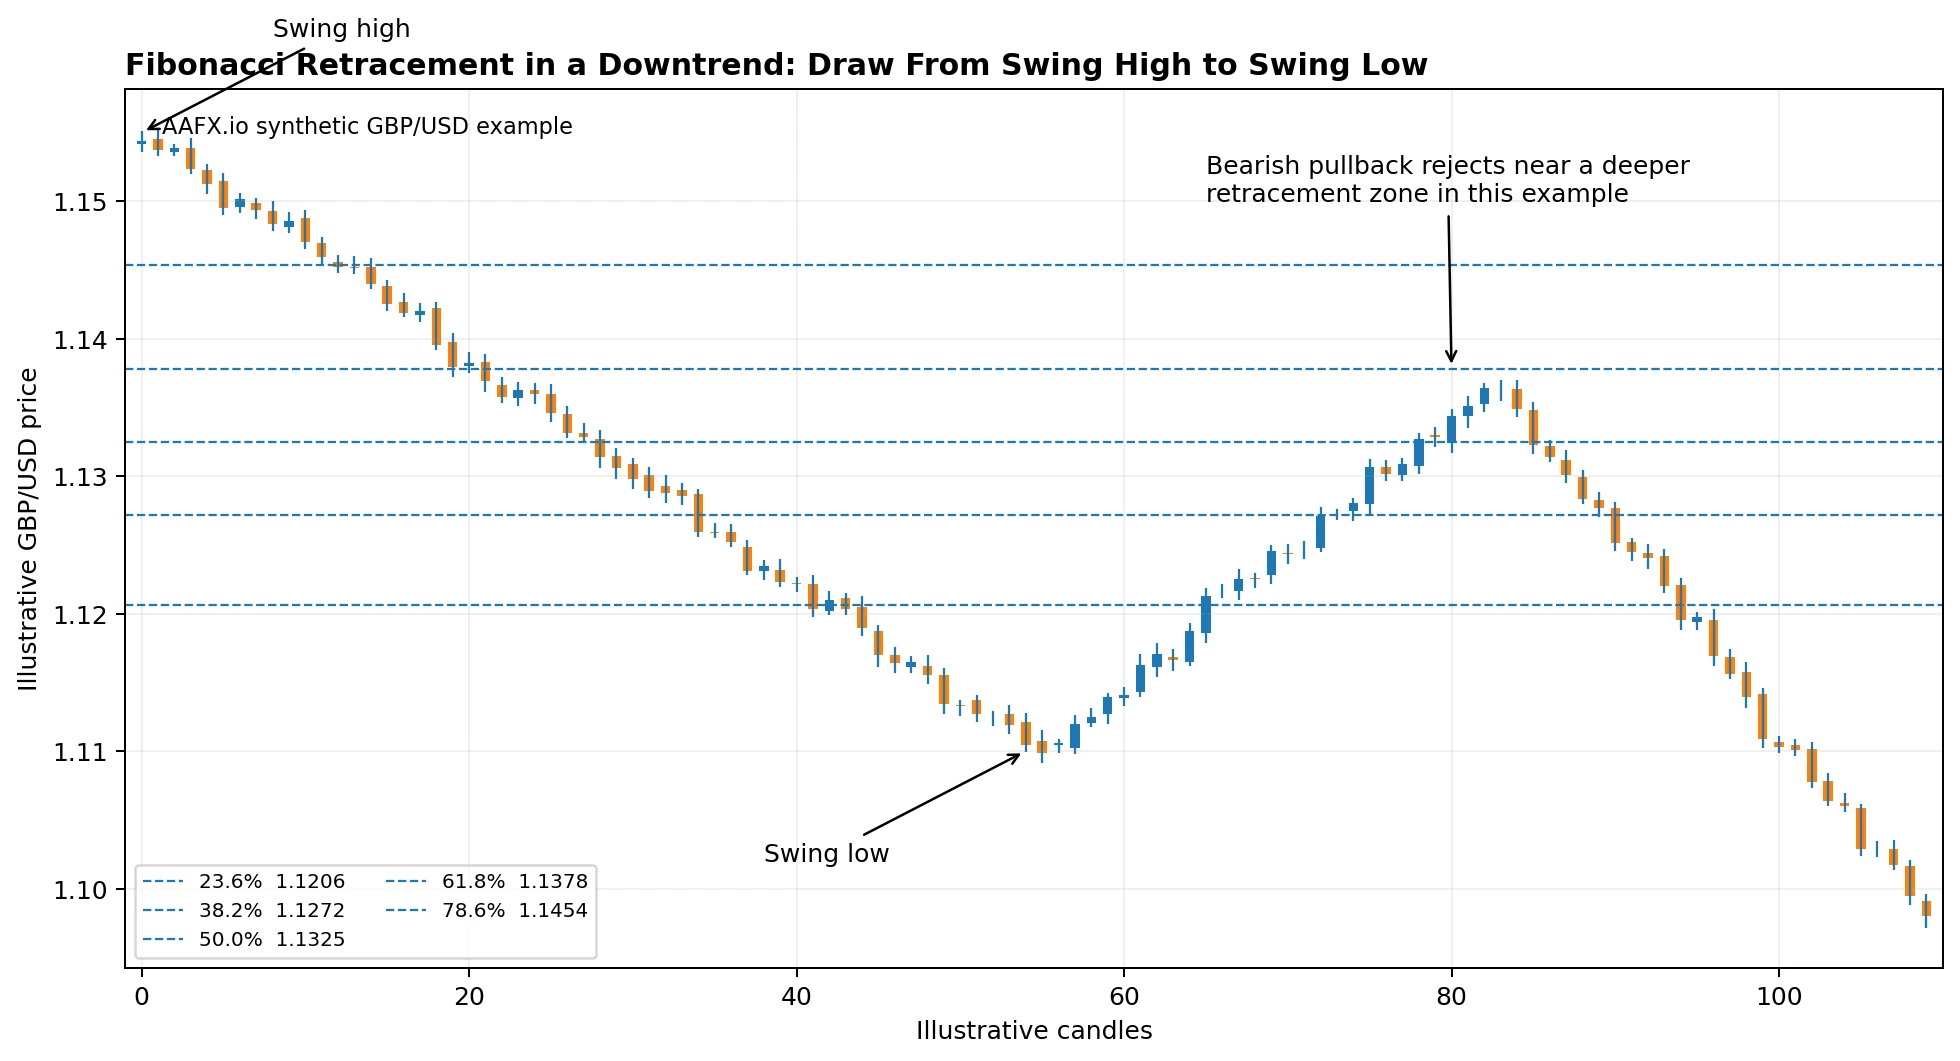
In a downtrend, the tool is drawn from swing high to swing low. Retracement levels then map possible resistance areas during a rebound.
How Do You Choose the Right Swing High and Swing Low?
This is one of the most subjective parts of Fibonacci analysis. If two traders choose different anchors, they get different levels. A good process therefore needs an anchor rule. The swing should represent the impulse you are actually trying to measure, not the pair of points that creates the prettiest historical reaction.
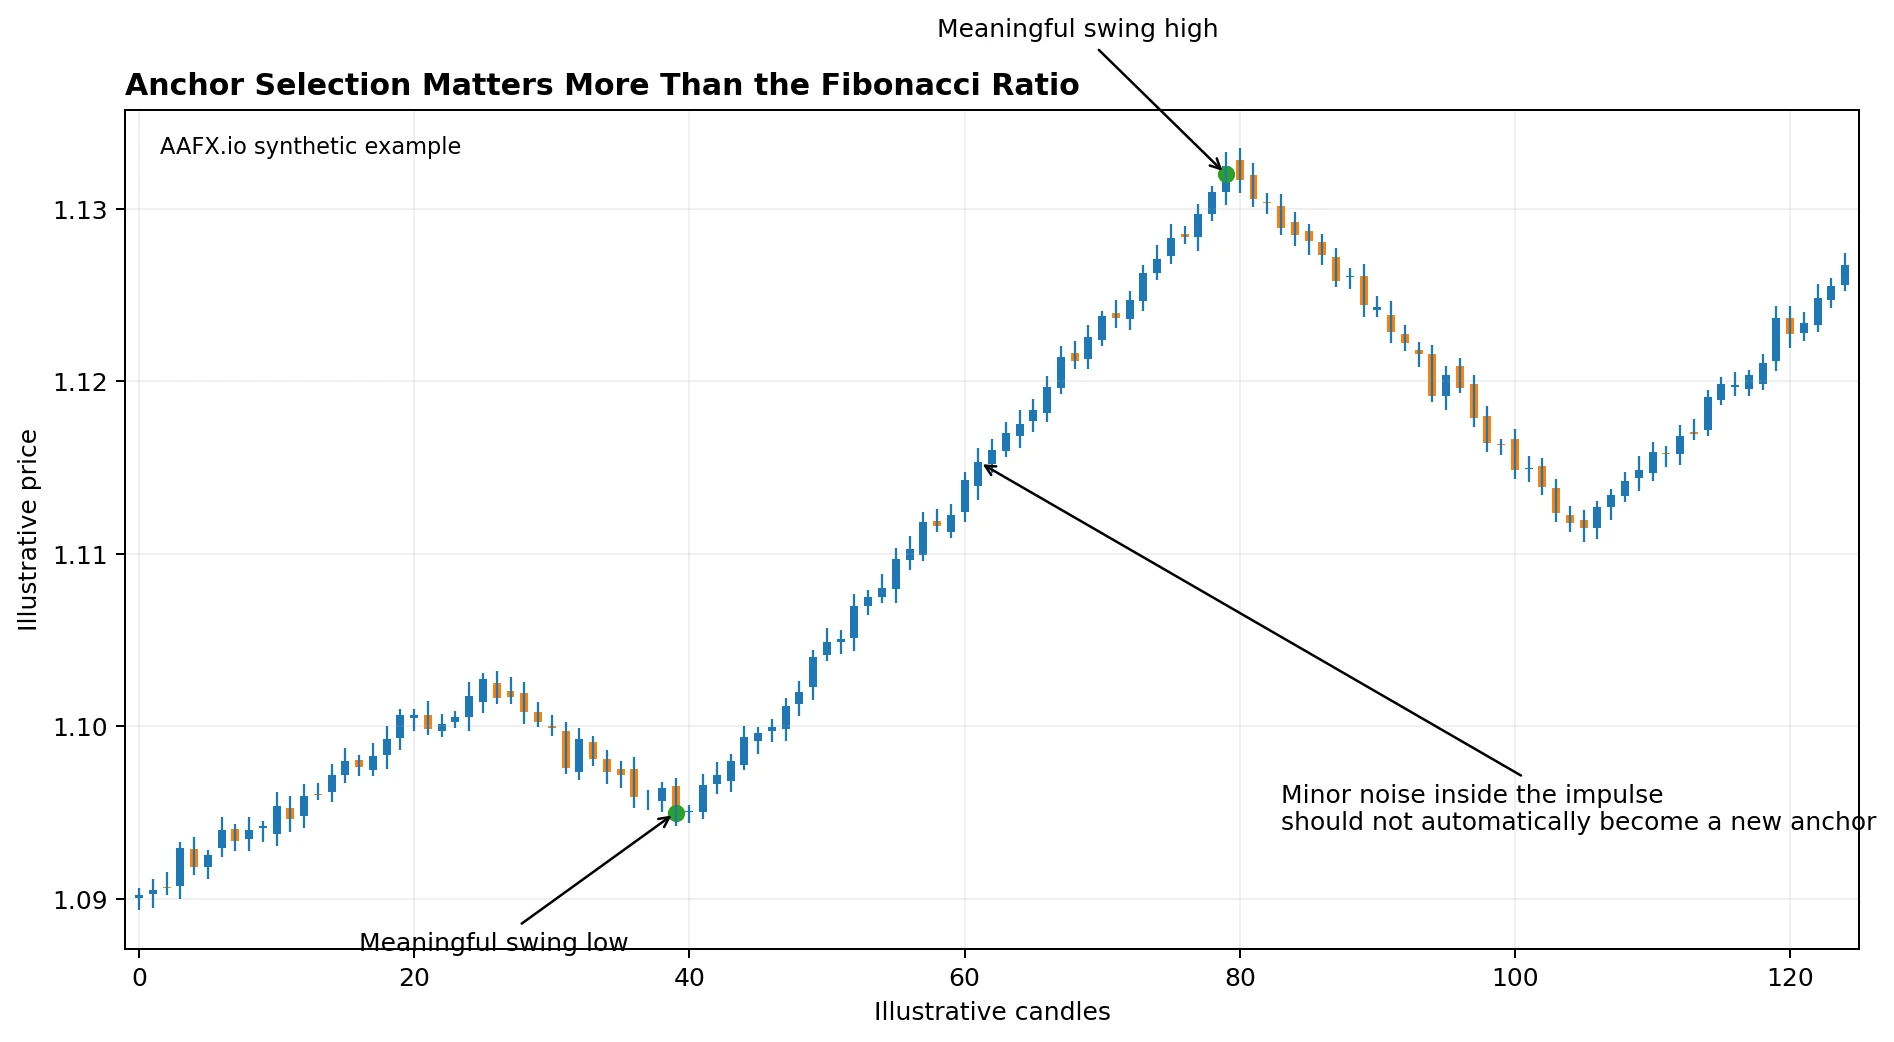
Choose the swing that defines the impulse under analysis. Constantly moving the anchors to fit later price action turns Fibonacci into hindsight rather than a testable method.
- Use obvious swing points that are visible on the chosen timeframe.
- Decide in advance whether the anchor uses wick extremes or candle closes.
- Keep the rule consistent across backtests.
- Do not redraw the tool after seeing which ratio price respected.
- If the market is choppy and there is no clear impulse, the Fibonacci tool may not add useful information.
How to Calculate Fibonacci Retracement Levels
Most charting platforms calculate the levels automatically, but the manual formula makes the tool much easier to understand.
Swing range = Swing High – Swing Low
Uptrend retracement price = Swing High – (Swing range x Retracement ratio)
Downtrend retracement price = Swing Low + (Swing range x Retracement ratio)
Worked EUR/USD Example
Suppose EUR/USD rises from 1.0800 to 1.1200. The swing range is 0.0400, or 400 pips. The retracement levels are calculated downward from 1.1200.
| Retracement | Calculation | Price level |
|---|---|---|
| 23.6% | 1.1200 – (0.0400 x 0.236) | 1.1106 |
| 38.2% | 1.1200 – (0.0400 x 0.382) | 1.1047 |
| 50.0% | 1.1200 – (0.0400 x 0.500) | 1.1000 |
| 61.8% | 1.1200 – (0.0400 x 0.618) | 1.0953 |
| 78.6% | 1.1200 – (0.0400 x 0.786) | 1.0886 |
These are reference prices, not forecasts. If EUR/USD falls through 38.2%, the 50% level does not become a guaranteed floor, and if price reaches 61.8%, it does not mean the trend must resume.
What Does a Shallow or Deep Fibonacci Retracement Mean?
Retracement depth describes how much of the prior impulse has been given back. A shallow 23.6% to 38.2% correction can occur in a strong trend. A 50% to 61.8% pullback is deeper. A 78.6% retracement gives back most of the move and may leave little room before the original swing is fully retraced.
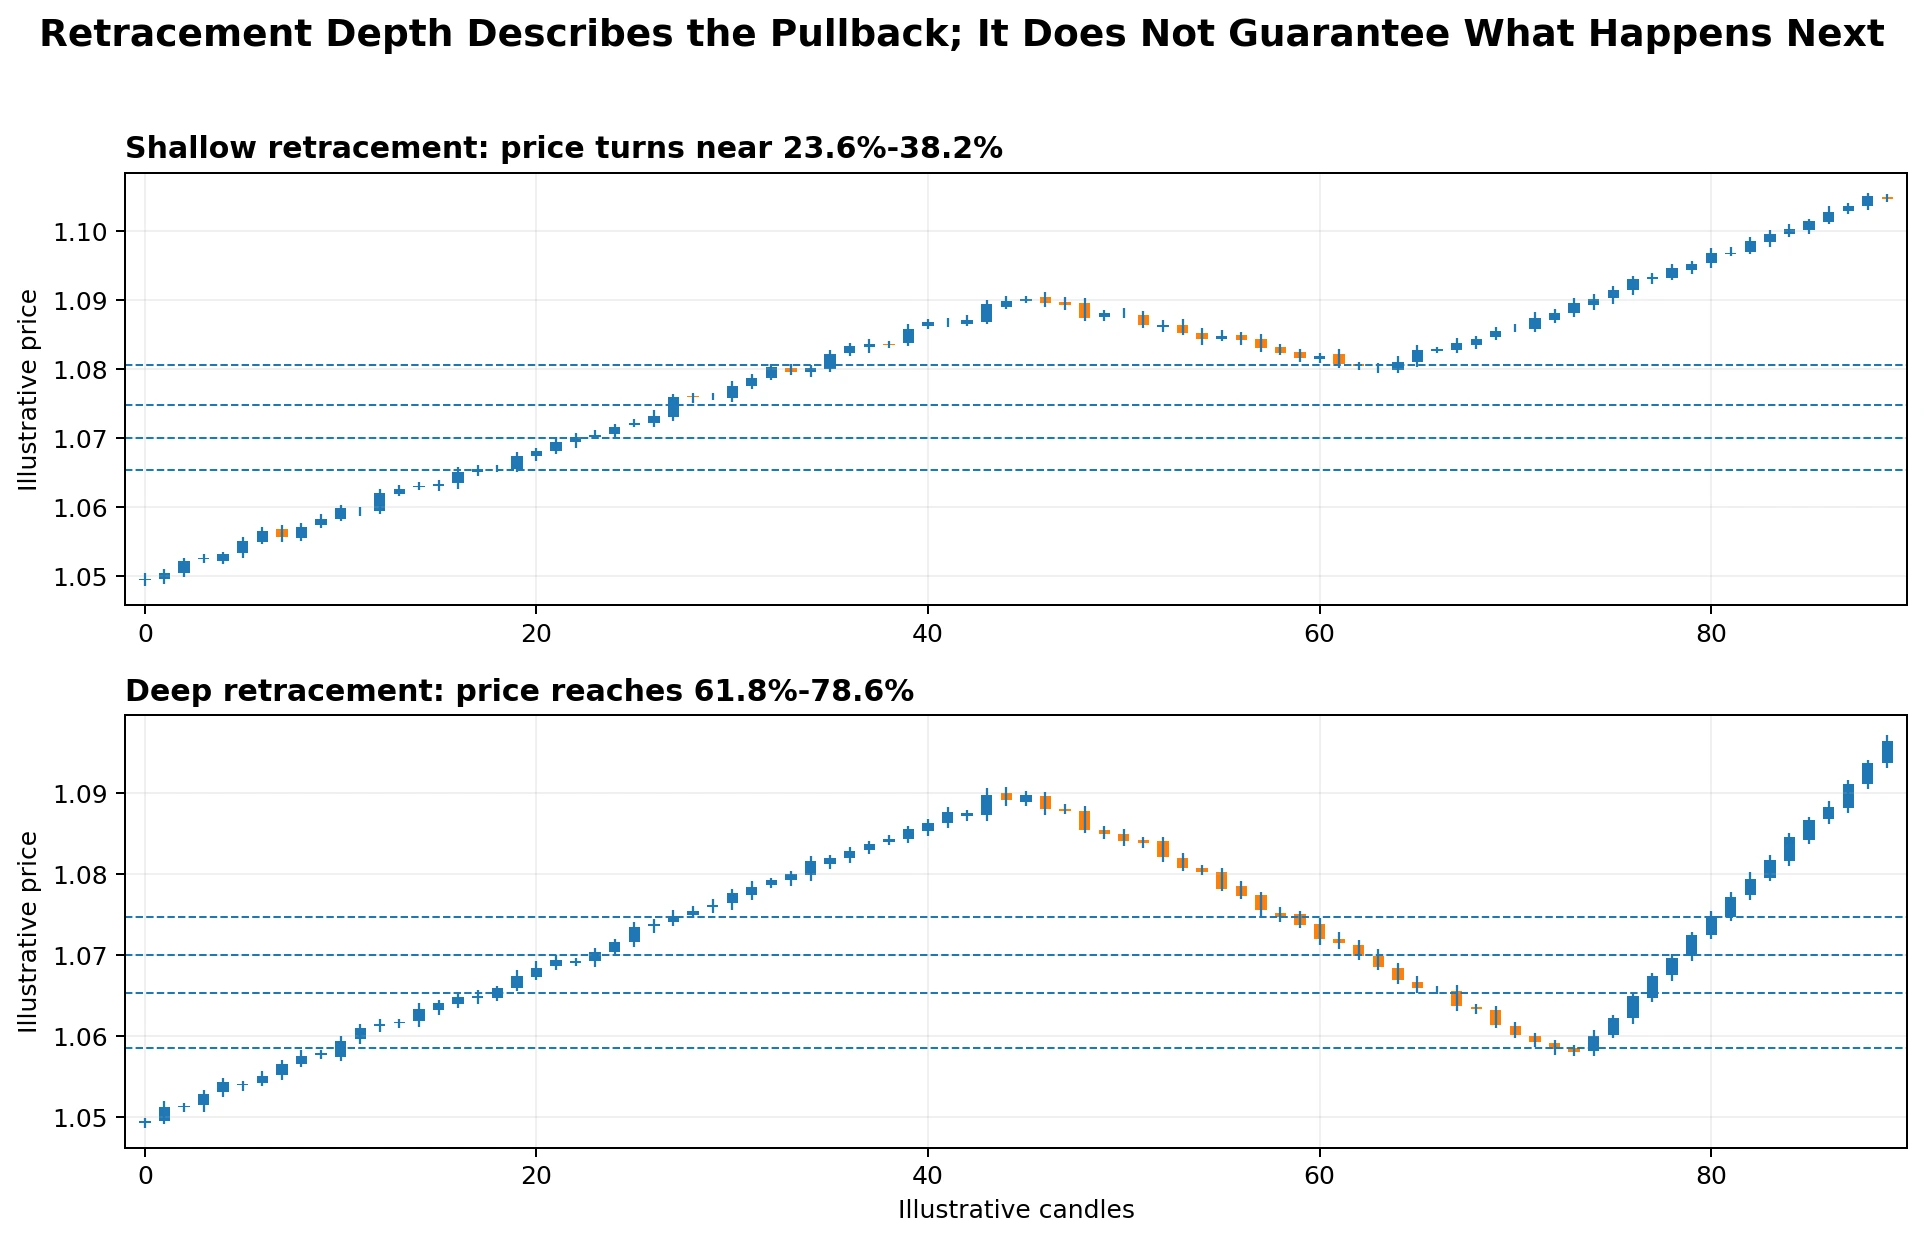
Shallow and deep retracements describe different pullback structures. Neither depth is automatically better. The relevant question is whether the original trend structure remains intact.
Ranking some retracement levels as inherently significant and others as weak is not a robust way to use the tool. The behavior of the pair, timeframe and strategy matters more than a universal hierarchy of Fibonacci percentages.
What Is the 61.8% Golden Ratio in Forex?
The 61.8% retracement is linked to the golden ratio because ratios between successive Fibonacci numbers converge toward about 0.618. It is one of the most widely watched Fibonacci levels in technical analysis. That popularity makes it a common reference point, but it does not prove that institutional algorithms must buy or sell there.
What Is the Fibonacci Golden Pocket?
Some traders use the term golden pocket for a zone around 61.8% to roughly 65% or 66%. This is a trading convention rather than a single standardized Fibonacci ratio. If you use a golden-pocket rule, define the exact upper and lower boundary before backtesting instead of changing the zone from one chart to another.
Fibonacci Confluence: When a Level Becomes More Useful
Fibonacci is strongest as a location tool. A retracement level becomes more interesting when independent evidence points to the same area. Confluence reduces the temptation to trade every line on the chart.
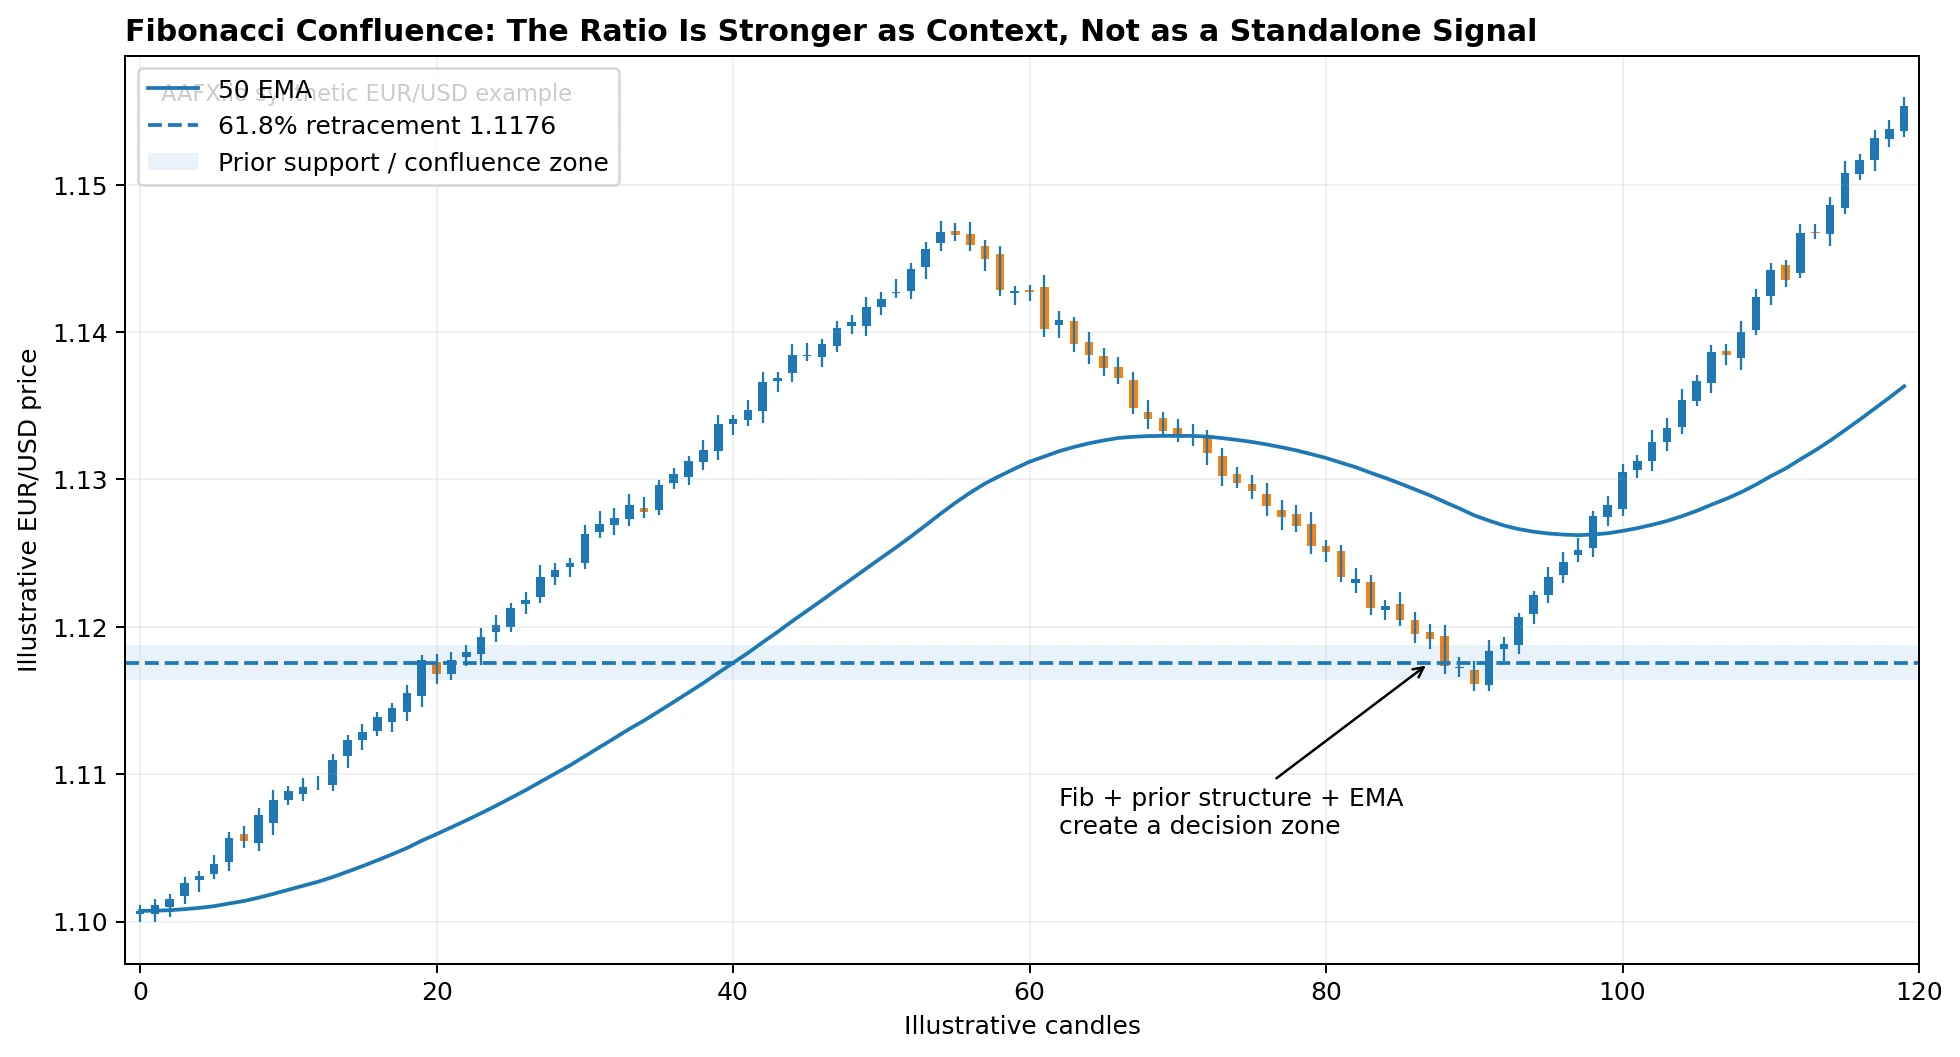
A 61.8% retracement overlapping with prior support and a rising moving average creates a more defensible decision zone. The trade still requires confirmation and invalidation.
| Confluence factor | Why it helps | Caveat |
|---|---|---|
| Horizontal support/resistance | Adds actual historical price structure. | A prior level can still fail. |
| Trendline or channel | Connects the retracement to trend geometry. | Anchor choice can be subjective. |
| Moving average | Adds dynamic trend context. | The MA is also derived from price and may lag. |
| Candlestick reaction | Shows how price behaved when it reached the zone. | A reversal candle can fail after completion. |
| Momentum indicator | Can show strengthening or weakening momentum. | RSI/MACD are not independent proof of a reversal. |
| Round number | Adds a widely watched psychological reference. | Round numbers are zones, not precise barriers. |
What Is a Fibonacci Cluster?
A Fibonacci cluster forms when retracement levels measured from two or more meaningful swings overlap in a similar price area. Some traders treat that overlap as a higher-interest zone because multiple measurement frameworks point to the same location.
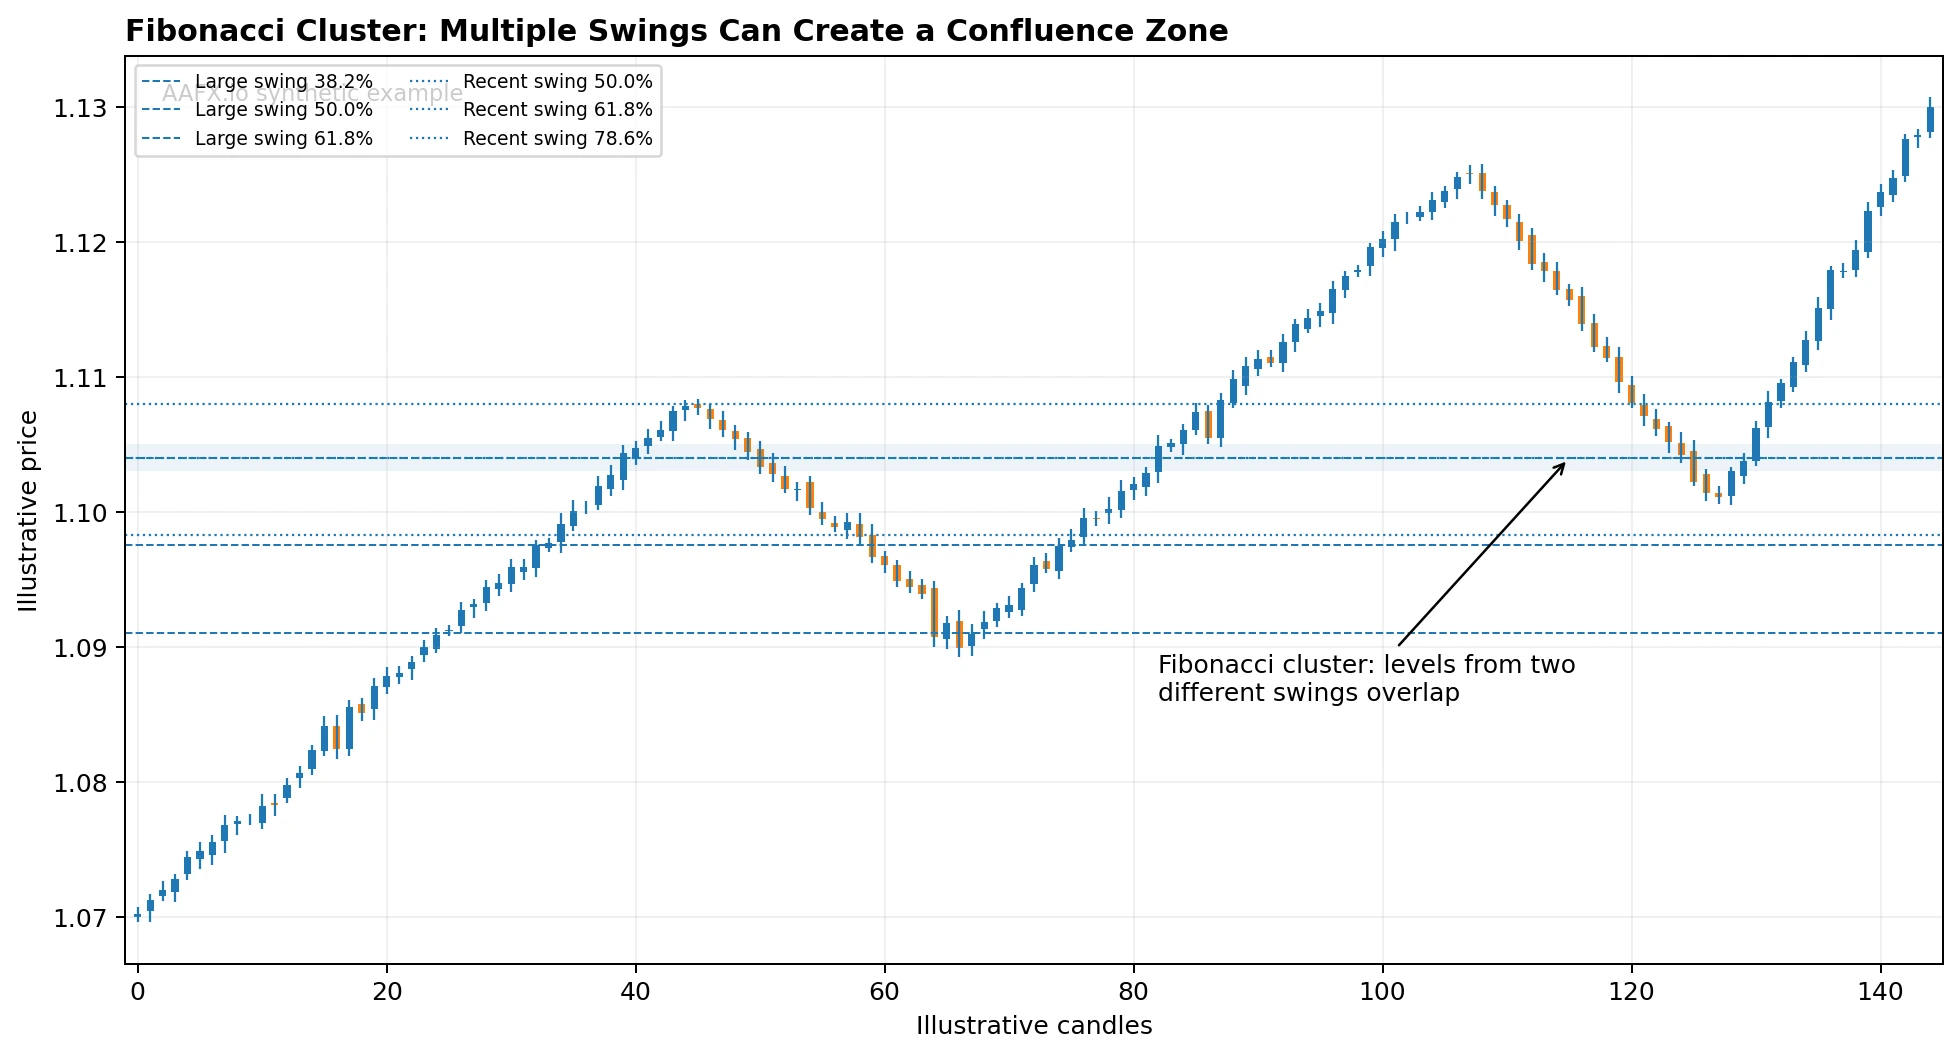
A Fibonacci cluster uses more than one swing. The overlapping ratios create a zone to investigate, not an automatic entry.
Clusters can become a source of curve fitting if too many swings are drawn. Limit the number of swings and define which timeframes or impulse legs qualify before looking at the result.
Why Fibonacci Retracement Levels Fail
A market can slice through several retracement levels without meaningful reaction. That is normal. The ratios are reference levels, not support orders that must exist in the market. New information, trend acceleration, positioning changes and liquidity conditions can overwhelm any technical setup.
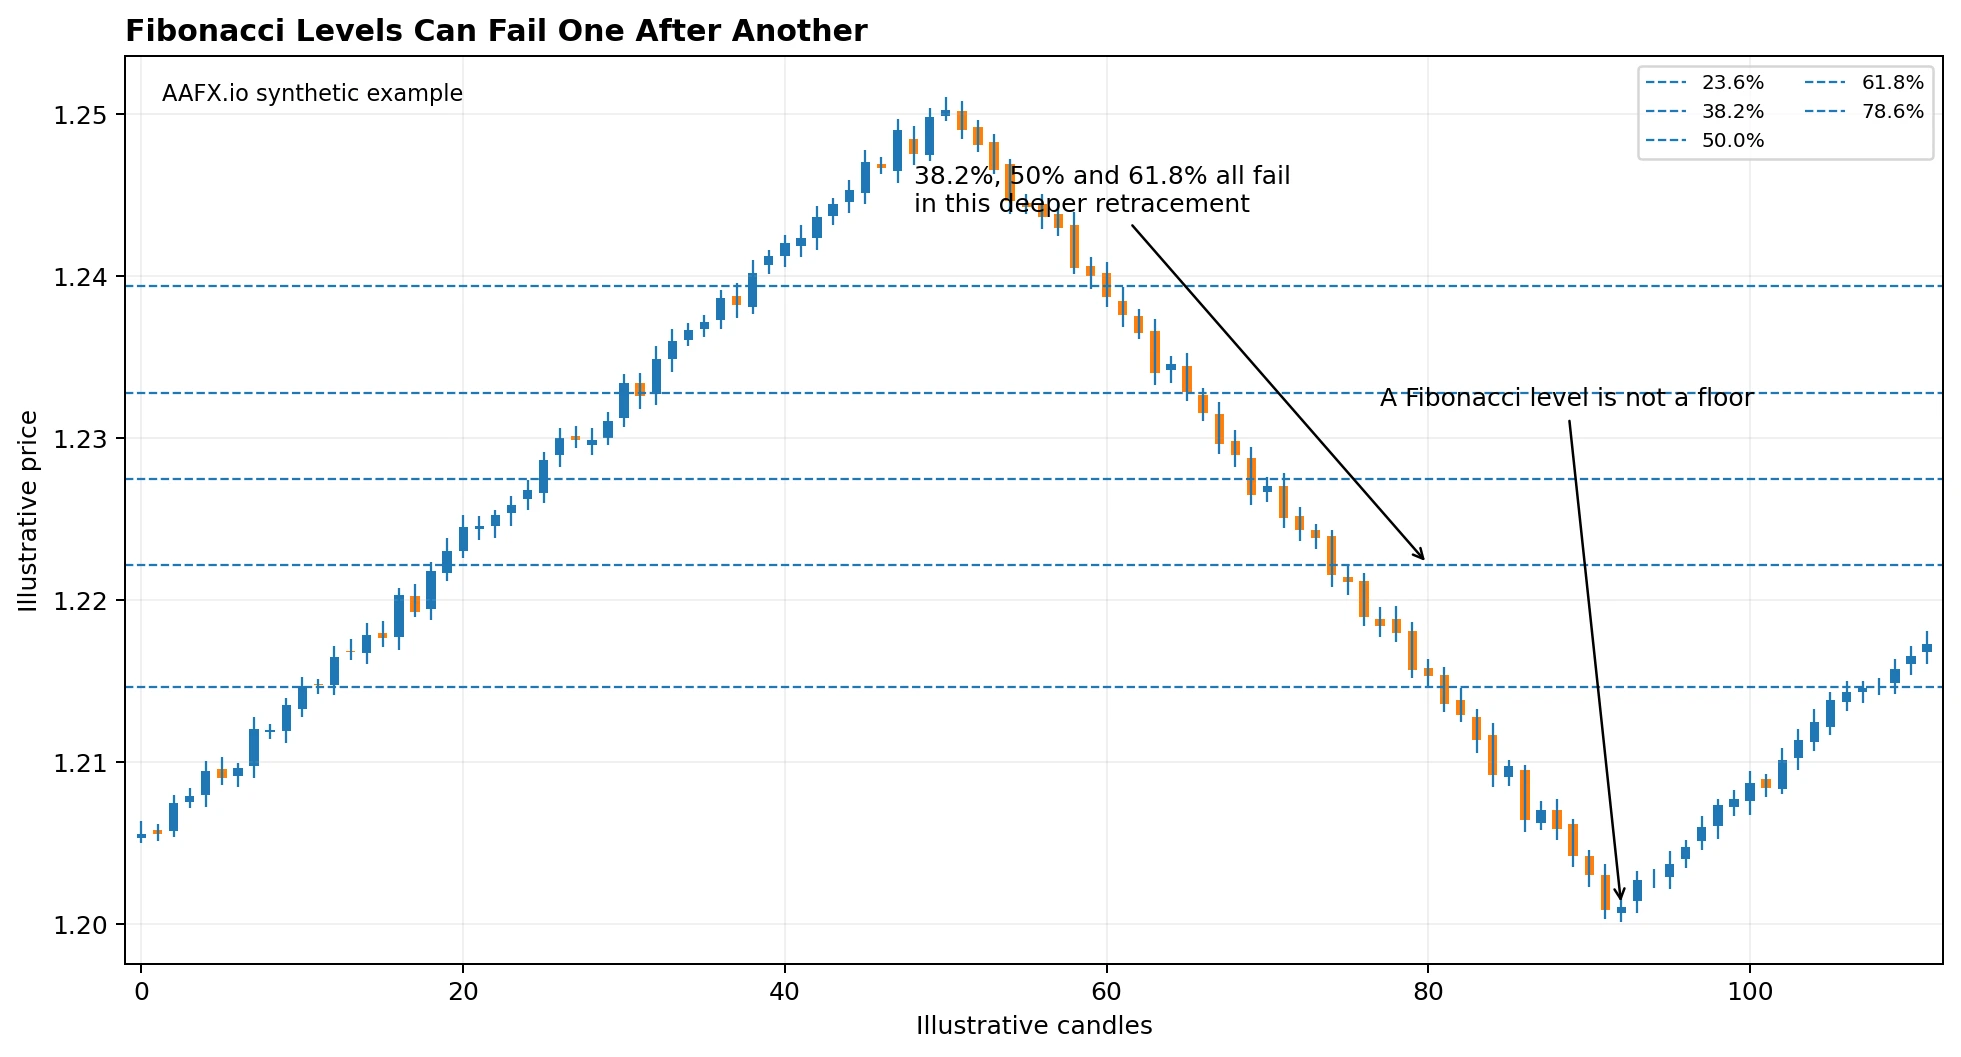
A pullback can break 38.2%, 50% and 61.8% in sequence. Fibonacci should help organize the analysis, not encourage repeated entries at every lower level.
This is especially important for leveraged traders. Averaging into every Fibonacci level can quietly turn a failed setup into an oversized position. The invalidation rule should be decided before the first entry.
A Practical Fibonacci Pullback Strategy Framework
A Fibonacci strategy should be more specific than “buy 61.8%.” The following framework is intentionally process-based rather than a universal trading system.
- Identify a clear directional impulse on the setup timeframe.
- Draw Fibonacci from the defined swing low to swing high in an uptrend, or swing high to swing low in a downtrend.
- Mark horizontal structure and other independent confluence before price reaches the retracement zone.
- Wait for a predefined trigger such as a completed rejection candle, break of a minor countertrend line or another tested confirmation rule.
- Place the invalidation where the trend-continuation thesis is objectively wrong.
- Calculate position size from the stop distance and risk budget.
- Use the prior swing or extension levels only as target references, not guaranteed exits.
- Record whether the setup followed the written rules, including failed signals.
Hypothetical EUR/USD Trade Planning Example
Imagine EUR/USD completes a bullish impulse from 1.0800 to 1.1200. The 50% and 61.8% levels sit near 1.1000 and 1.0953. If a prior support zone also lies around 1.0960 to 1.1000, a trader might define that overlap as the area of interest. The trade is not entered simply because price arrives there. The plan could require a bullish candle close back above local structure. If that confirmation appears, the stop can be placed beyond the price structure that invalidates the setup, and position size can be calculated from that distance.
If price instead closes decisively below the invalidation area, the Fibonacci thesis has failed. The correct response is not to keep buying each lower ratio simply because another Fibonacci line exists.
Fibonacci Retracement vs Fibonacci Extension
Retracement levels sit inside the original swing and measure how much of that move has been given back. Extensions project reference levels beyond the original swing high or low and are often used for target planning after a trend resumes.
| Tool | Typical levels | Main use |
|---|---|---|
| Retracement | 23.6%, 38.2%, 50%, 61.8%, 78.6% | Map pullback depth inside the original swing. |
| Extension | 127.2%, 161.8%, 200%, 261.8% | Map possible target or reaction areas beyond the original swing. |
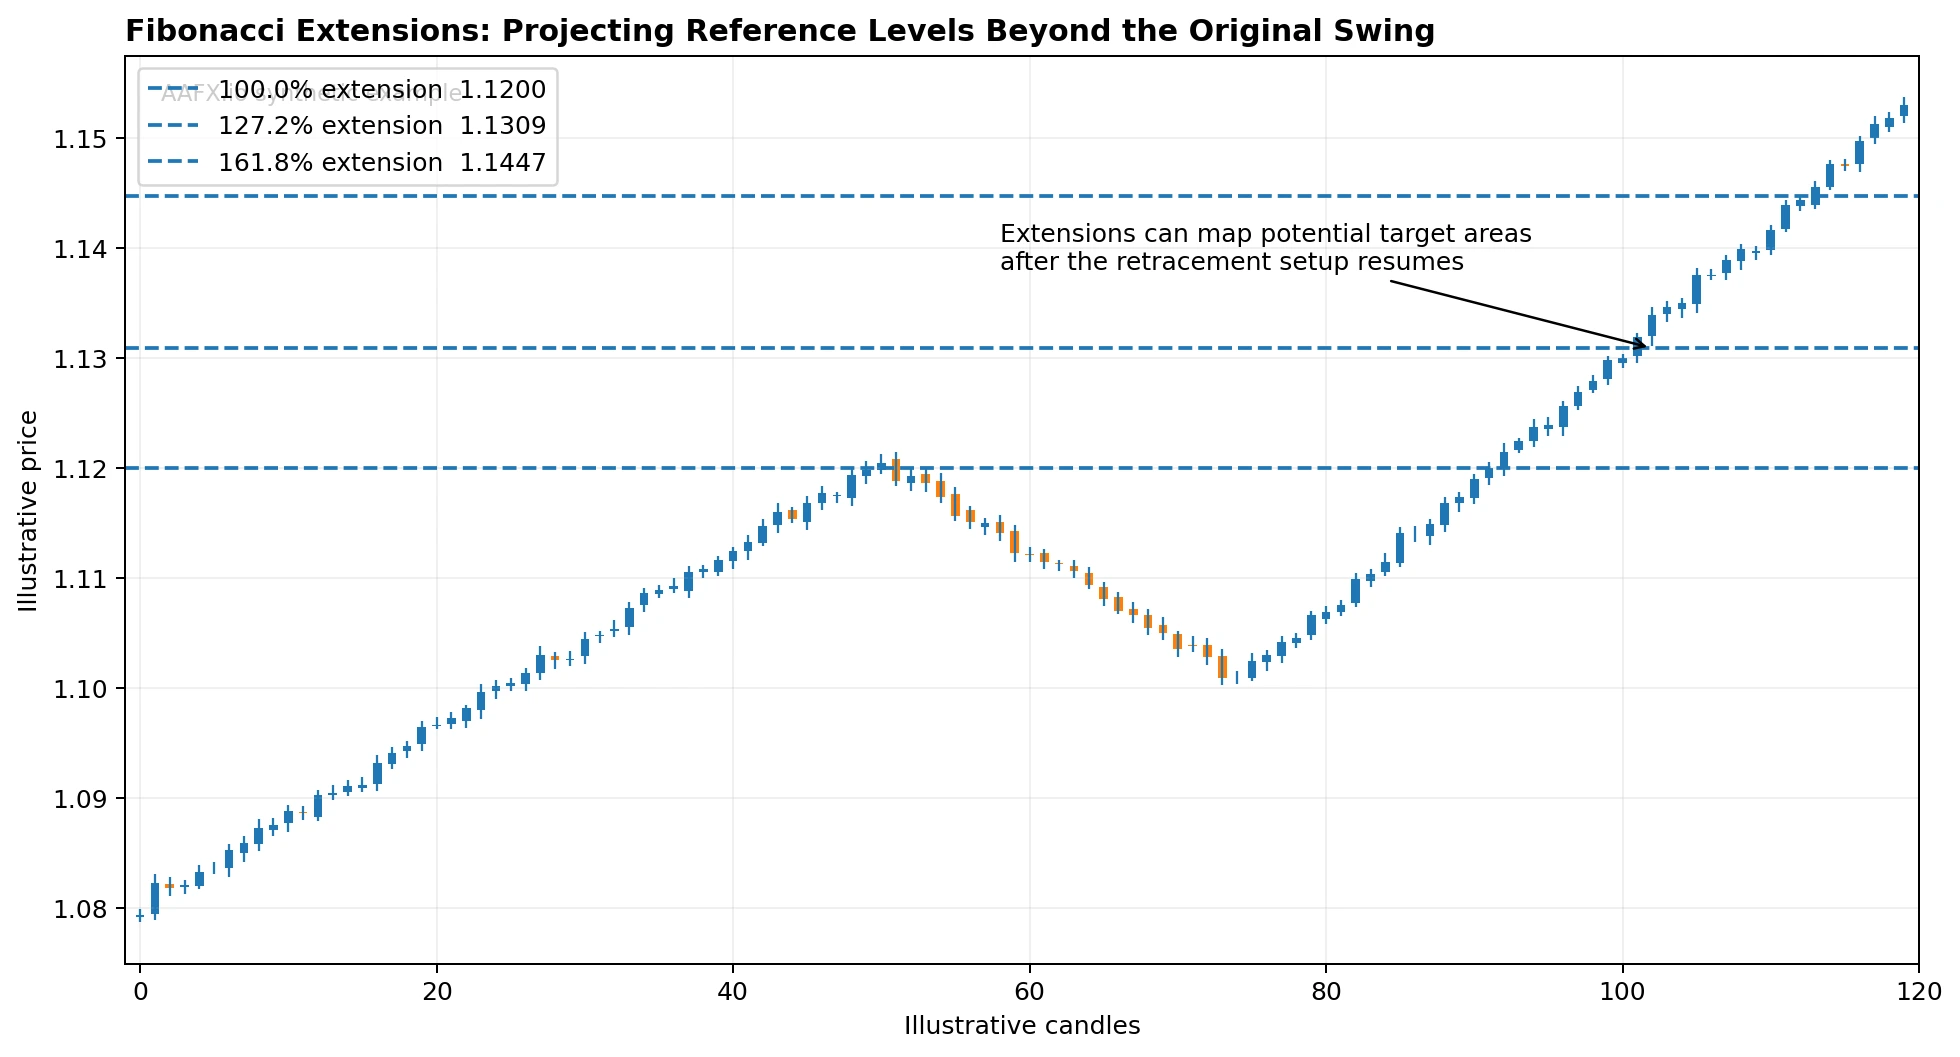
Extensions project beyond the original swing. They can help plan targets after a breakout, but they are reference levels rather than price objectives the market must reach.
Using Fibonacci Across Multiple Timeframes
The same ratio means different things on different timeframes because the swing being measured is different. A 61.8% retracement of a weekly move can span hundreds of pips, while the same percentage on a 15-minute chart may cover only a small intraday fluctuation.
A clean workflow gives each timeframe one role. The higher timeframe defines the major trend and swing. The setup timeframe identifies the pullback. A lower timeframe may be used for the trigger if the strategy requires it. Avoid redrawing Fibonacci on progressively smaller charts until one level matches current price.
Fibonacci Retracement Around Forex News
Economic releases and central-bank decisions can move currency pairs through several Fibonacci levels in seconds. A retracement level does not reduce gap risk, spread widening or slippage. If the strategy was designed for normal liquidity conditions, high-impact news can place it in the wrong market regime.
Because spot forex is decentralized, the chart also cannot prove that a Fibonacci line contains a specific pool of global liquidity. Many traders may watch the same levels, but that is different from observing a centralized order book.
How to Backtest a Fibonacci Strategy
- Define exactly what qualifies as the impulse swing.
- Fix the anchor rule: wick to wick, close to close, or another objective method.
- Fix the ratios used in the test instead of changing them after the result.
- Define whether the setup trades one ratio or a zone such as 38.2% to 61.8%.
- Define the confirmation rule separately from the Fibonacci location.
- Include spread, commission, financing and realistic slippage.
- Define the stop from structure and calculate position size before measuring returns.
- Test all qualifying signals, including deep retracements and complete failures.
- Use out-of-sample data to check whether the rule survives beyond the period used to design it.
The main danger is hindsight. If the swing, Fibonacci ratio, confirmation indicator and stop are all chosen after seeing the outcome, almost any historical chart can be made to look convincing.
Common Fibonacci Retracement Mistakes
Treating Fibonacci as predictive law
The ratios do not force price to reverse. They organize possible pullback zones.
Using the wrong swing anchors
Different anchors create different levels. The anchor rule must be consistent.
Drawing Fibonacci in a random range
The tool is most interpretable when there is a clear impulse to measure.
Calling 50% a Fibonacci ratio
The 50% level is a widely used trading convention, not a ratio derived from the sequence.
Assuming 61.8% is always the strongest level
It is widely watched, but no ratio is universally most reliable across markets and timeframes.
Buying or selling on the level alone
A Fibonacci line is location, not a complete trading signal.
Adding too many Fibonacci tools
Multiple overlapping drawings can create meaningless hindsight confluence.
Moving the anchors after the trade
This destroys testability and lets the analysis adapt to whatever price already did.
Using extensions as guaranteed targets
127.2% or 161.8% are possible reference areas, not destinations the market must reach.
Ignoring risk management
A valid Fibonacci setup can still lose. The stop, position size and account exposure matter more than the elegance of the ratio.
Fibonacci Retracement Checklist Before a Trade
- Is there a clear impulse swing to measure?
- Am I using the correct direction for the trend?
- Are my swing anchors defined consistently?
- Which Fibonacci ratios are part of my tested rule?
- Does the level overlap with real support, resistance, trend structure or another independent reference?
- What exact price action confirms the setup?
- Where is the original trend-continuation thesis invalidated?
- Is major economic news close enough to change normal market behavior?
- What position size fits the stop distance?
- Am I using an extension as a target reference rather than an assumption?
- Would I still take the setup if the Fibonacci labels were hidden and only the market structure remained?
Frequently Asked Questions
What is Fibonacci retracement in forex?
Fibonacci retracement is a technical-analysis tool that divides a swing high-to-low or low-to-high move into percentage pullback levels where price may react.
What are the main Fibonacci retracement levels?
The most commonly watched levels are 23.6%, 38.2%, 50%, 61.8% and 78.6%. Some platforms also include 76.4%, 88.6% and other custom levels.
Is 50% a Fibonacci number?
No. The 50% retracement is a trading convention. It is widely used but is not derived from the Fibonacci sequence.
Why is 61.8% important?
It is related to the golden ratio because successive Fibonacci numbers converge toward a ratio near 0.618. Traders watch it widely, but that does not make it a guaranteed reversal level.
What is the Fibonacci golden pocket?
It is an informal trading zone often defined around 61.8% to 65% or 66%. The exact boundaries are not standardized and should be fixed before testing.
How do you draw Fibonacci retracement in an uptrend?
Draw from the meaningful swing low to the swing high, then watch the percentage levels below the high as price pulls back.
How do you draw Fibonacci retracement in a downtrend?
Draw from the meaningful swing high to the swing low, then watch the levels above the low during a rebound.
Which Fibonacci retracement level is the strongest?
There is no universally strongest level. 38.2%, 50% and 61.8% are widely watched, but performance depends on the swing, market, timeframe, confirmation rule and risk management.
What is 78.6% Fibonacci retracement?
78.6% is a commonly used deep retracement level, often derived as the square root of 61.8%. It sits close to a full retracement of the original swing.
Does Fibonacci retracement work in forex?
It can be useful for organizing pullbacks and confluence, but it does not predict price reliably by itself. The best way to judge a Fibonacci rule is to define it precisely and backtest it.
Should I use Fibonacci with RSI or MACD?
They can add momentum context, but they should not be counted as proof that a Fibonacci level must hold. Use each tool for a distinct purpose.
What is the difference between Fibonacci retracement and extension?
Retracements measure pullbacks inside the original swing. Extensions project possible reaction or target levels beyond the original high or low.
Can Fibonacci be used for stop-loss placement?
The Fibonacci level can help define the setup area, but the stop should normally sit where the technical thesis is invalidated rather than at an arbitrary fixed distance from the ratio.
Which timeframe is best for Fibonacci retracement?
No timeframe is universally best. Higher timeframes measure larger swings and generate fewer setups, while lower timeframes provide more signals and more noise.
Can Fibonacci be used in sideways markets?
It can be drawn, but the analysis is less clear because there may be no obvious impulse leg. Horizontal support and resistance are usually more direct in a range.
Are Fibonacci levels self-fulfilling?
They may become common reference points because many traders watch them, but that does not prove that orders or liquidity must cluster at every ratio, especially in decentralized spot forex.
Bottom Line
Fibonacci retracement is best used as a map, not a prediction. The tool measures the depth of a pullback and creates standardized zones where traders can look for a reaction. The level becomes useful only when the rest of the chart supports it.
The most important skill is not memorizing 23.6%, 38.2%, 50%, 61.8% and 78.6%. It is choosing the correct swing, drawing the tool consistently, distinguishing retracement from extension, and knowing what price behavior would invalidate the setup.
For AAFX.io, the practical framework is simple: use Fibonacci for location, Support and Resistance for structure, Candlestick Patterns for confirmation, Moving Averages or RSI only when they add a distinct layer of information, and Risk Management and Position Sizing to control the loss if the market ignores every ratio on the chart.
Editorial Sources
- Fidelity: Fibonacci Retracement
- BabyPips: How to Use Fibonacci Retracements
- TradingView: Fibonacci Retracement Drawing Tool
Risk warning: Forex and leveraged trading involve substantial risk. Fibonacci levels can fail and stops may slip in fast markets. Educational only, not personalized financial advice.
Sources & Methodology
Primary-source standard: Market-moving facts should link to original data releases, regulator notices, company filings or official project announcements whenever available. Secondary reporting is used for additional context, not as a substitute for original evidence.
Page last reviewed: