To learn how to read trading charts, start with the symbol, timeframe and price feed, then read each candle’s open, high, low and close before you look for levels, trends or indicators. That order keeps what the chart actually shows separate from what you think might happen next.
This guide is part of our technical analysis hub. It uses one hypothetical hour of EUR/USD from start to finish, so you can rebuild every number on paper or on a free chart. For live prices to practise on, open our live charts.
Risk warning: Reading a chart well does not make a trade safe. Leveraged forex and CFD trading can lose money quickly, and a stop order can fill beyond its price in a fast market. All prices in this guide are hypothetical.
AAFX.IO may earn a commission through links on this page. This does not change our ratings or the tools we explain.
How do you read a trading chart for beginners?
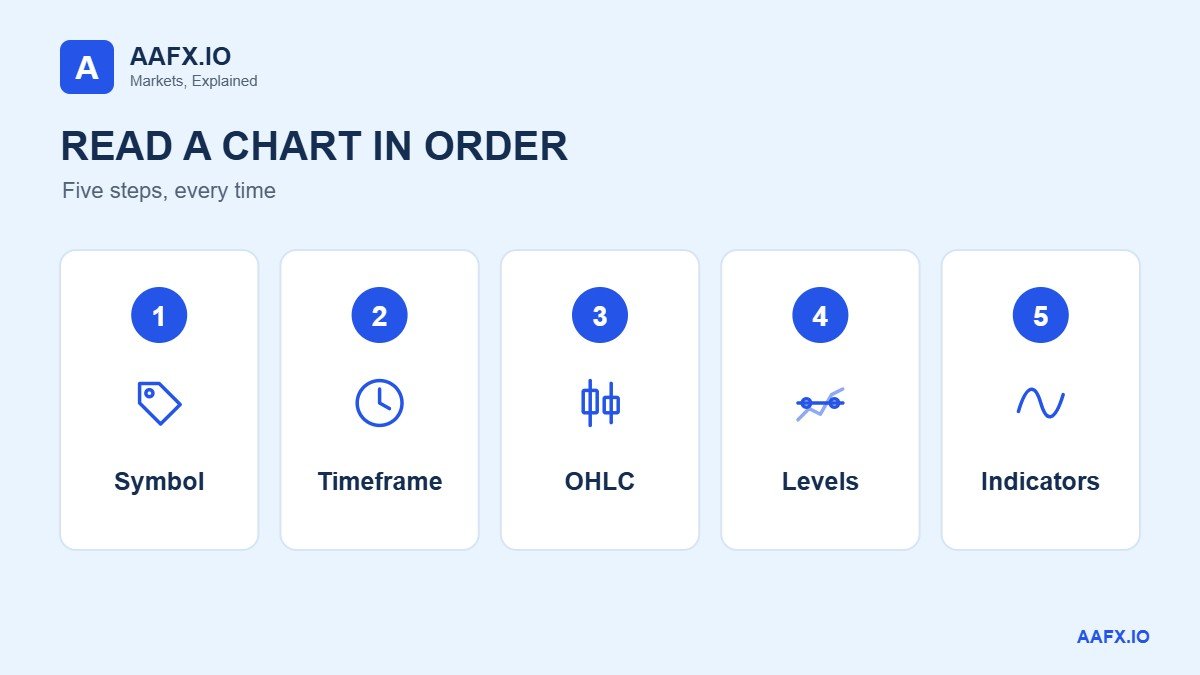
Read the header first: the pair, the timeframe and whether prices are bid, ask or mid. Then read time from left to right and price from bottom to top. For each candle, note the open, high, low and close. Only after that, mark recent highs and lows and describe the trend. Indicators come last, once you know what price itself did.
What do green and red candles mean?
On most platforms a green candle closed above its own open and a red candle closed below its own open. The colour says nothing about the previous candle, so a red candle can still finish higher than the one before it. Colours are a setting, not a rule. Check your platform’s legend or hover over the candle to read the four prices.
How to read trading charts: overview
- Start with the symbol, timeframe and price feed
- Measure moves in pips and percent
- Read one candlestick: open, high, low and close
- Line, bar or candlestick: which chart to use
- How shorter candles build a longer one
- Mark a level and decide what counts as a break
- Describe trend, range and volatility separately
- Add indicators only after reading price
- A two-minute chart reading exercise
- AAFX.IO: read the header before the pattern
- Frequently Asked Questions
Start with the symbol, timeframe and price feed
In EUR/USD, the euro is the base currency and the US dollar is the quote currency. A price of 1.0800 means one euro costs 1.0800 dollars on that feed. If the price rises to 1.0810, the euro buys slightly more dollars. Reverse the pair and the number means something else, so read the full symbol before comparing two screenshots. Our forex basics section covers quotes in more detail.
The horizontal axis is time. On a fifteen-minute chart, each candle summarises fifteen minutes. The labels may only appear under every fourth or eighth candle, so hover to identify a single bar, and check whether its time marks the start or the end of the interval. In this guide, timestamps mark the start and all times are UTC.
The vertical axis is price. Two candles that look the same height on different screens can represent very different moves, because each screen has its own scale. Read the distance between two labelled prices rather than judging by eye. Zooming in makes an ordinary move look dramatic without changing a single price.
Finally, look for a feed label. The bid is roughly where you can sell and the ask where you can buy; the mid is halfway between. The examples here use mid prices, which matters later when a chart and an order history disagree.
Measure moves in pips and percent
For EUR/USD, one pip is 0.0001. Many screens show a fifth decimal, so a move from 1.08180 to 1.08185 is half a pip, not five. Most yen pairs use 0.01 as one pip. Counting the last digit without checking the pip size can turn a 5-pip move into a supposed 50-pip move.
| Hypothetical move | Price change | Pips | Percent |
|---|---|---|---|
| EUR/USD 1.08180 to 1.08185 | 0.00005 | 0.5 | 0.005% |
| EUR/USD 1.08180 to 1.08230 | 0.00050 | 5 | 0.046% |
| EUR/USD 1.0800 to 1.0818 | 0.0018 | 18 | 0.167% |
| USD/JPY 150.00 to 150.45 | 0.45 | 45 | 0.300% |
Percent change divides the move by the starting price, which makes pairs with different prices comparable. Neither pips nor percent gives a profit figure until you add a position size and costs. Our pip calculator converts pips into money for your account currency.
Read one candlestick: open, high, low and close
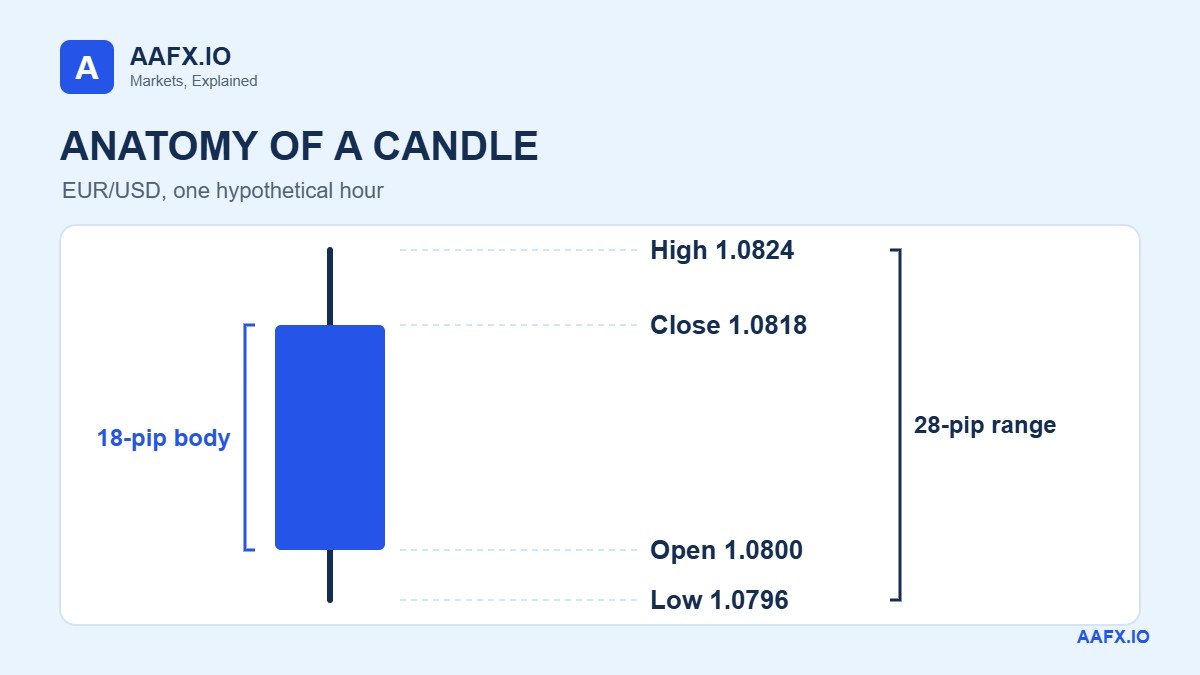
Suppose the EUR/USD hour starting at 09:00 opens at 1.0800, reaches a high of 1.0824, falls to a low of 1.0796 and closes at 1.0818. These four prices are called OHLC. The open is the first price in the hour and the close is the last. The high and low are the extremes reached at any time in between, and the close is only final when the hour ends.
The rectangle is the body; its ends mark the open and the close. Thin lines called wicks reach the high and low. Here the close is above the open, so the top of the body is the close. Most platforms colour this candle green, but colours can be changed, so check the numbers.
Now measure it. The full range is 1.0824 minus 1.0796, or 28 pips. The body covers 18 pips. The upper wick is 6 pips from the close to the high, and the lower wick is 4 pips from the low to the open. Six plus 18 plus 4 equals 28, a quick check that catches the common mistake of reporting the body as the whole range.
A wick shows where price went, not who traded there or why. A green candle can still contain a sharp fall inside the hour, and the four prices alone cannot tell you whether the high or the low came first. For candle shapes in context, see our forex candlestick patterns guide and the StockCharts ChartSchool introduction to candlesticks.
Line, bar or candlestick: which chart to use
The three common chart types use the same data in different ways. Choose the one that answers your question, not the one that looks busiest.
| Chart type | What it draws | Best for | What it hides |
|---|---|---|---|
| Line (close only) | A point at each close, joined up | Comparing closes over weeks | Every high and low inside each period |
| OHLC bar | A vertical stroke from low to high, ticks for open and close | Reading exact levels on a clean chart | Nothing, but bodies are harder to see at a glance |
| Candlestick | The same four prices with a filled body | Seeing direction and wicks quickly | The order of the high and low within the period |
Take four fifteen-minute closes: 1.0808, 1.0816, 1.0810 and 1.0818. A line chart ends at 1.0818 and gives no sign that the last quarter touched 1.0824. To check whether a level was reached, use highs and lows. To check which of two levels came first, even candles may not be enough, and you need a shorter timeframe.
How shorter candles build a longer one
The table shows the four fifteen-minute candles that make up our hour. Read across for each quarter’s range, then down the columns to find the hourly values.
| Start (UTC) | Open | High | Low | Close |
|---|---|---|---|---|
| 09:00 | 1.0800 | 1.0812 | 1.0796 | 1.0808 |
| 09:15 | 1.0808 | 1.0820 | 1.0804 | 1.0816 |
| 09:30 | 1.0816 | 1.0818 | 1.0806 | 1.0810 |
| 09:45 | 1.0810 | 1.0824 | 1.0808 | 1.0818 |
| Hour 09:00 | 1.0800 | 1.0824 | 1.0796 | 1.0818 |
The hourly candle takes the first open, the highest high, the lowest low and the last close. It does not average anything. The smaller candles also reveal something the hour hides: the low came in the first quarter and the high in the last.
Notice the 09:30 quarter. It closed 6 pips below its open while the hour closed 18 pips higher. Someone calling the quarter down and someone calling the hour up are both right. Always say which interval you mean.
Clocks matter too. A colleague’s chart set to UTC plus five shows the same hour as 14:00. If your screenshots still disagree after aligning the clock, compare the feed and the session start, because two platforms can group the same quotes into different four-hour or daily bars.
Mark a level and decide what counts as a break
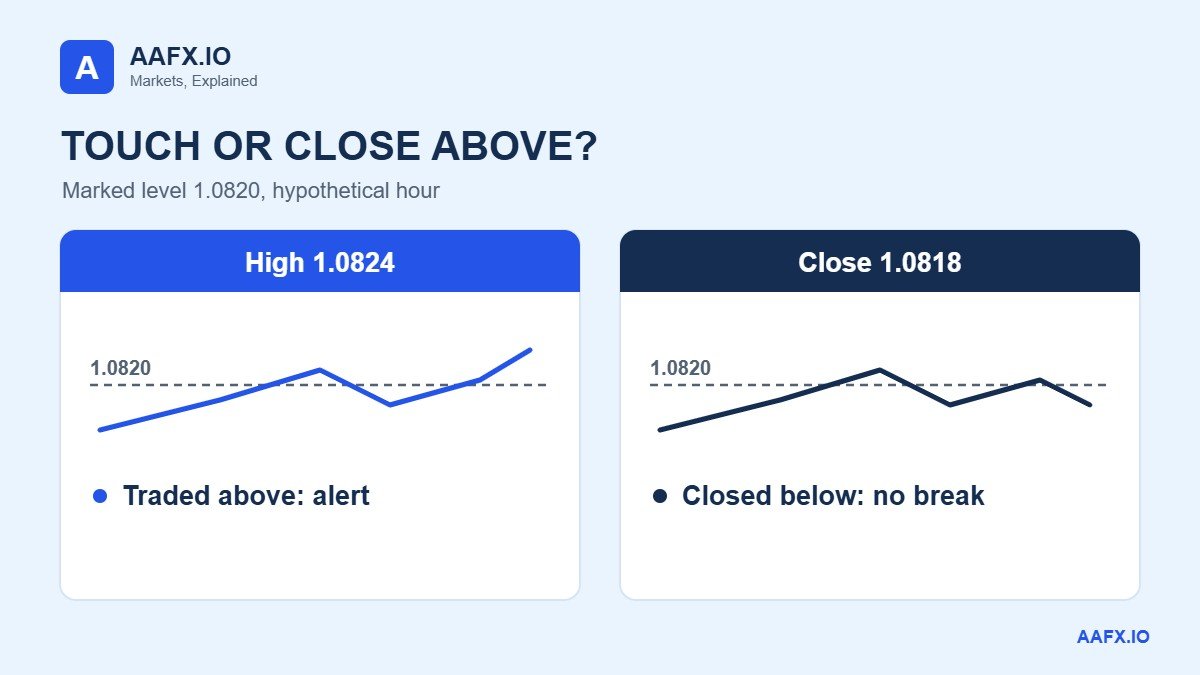
Suppose 1.0820 was marked from an earlier session. The 09:15 quarter touched it, the 09:45 quarter went 4 pips above it, and the hour closed 2 pips below it. Three statements are true: the level was touched, price traded above it, and the hour closed below it. There was no hourly close above 1.0820.
Decide which test you are applying before you look at the outcome. A touch is enough to trigger an alert. A breakout rule may need a completed close beyond the level. A retest rule needs a later return that holds. Changing the definition after the event lets almost any move count as confirmation.
Prior highs and lows usually cluster into a zone rather than a single price. Record the zone’s boundaries from what was visible at the time. Our support and resistance guide covers how to draw them, and widening a zone every time price crosses it removes its value.
Describe trend, range and volatility separately
A run of higher swing highs and higher swing lows supports calling the chart an uptrend on that timeframe. A lower high followed by a lower low suggests the structure is weakening. A swing is a local turning point, and if you need two lower highs to confirm a peak, the label only appears once those later bars exist.
A range looks different. Price returns to both an upper and a lower area, and attempts to move away keep failing. Four candles from one hour say little about either, so zoom out on the same interval, mark the swings that support your description and note which new price would change your mind.
Volatility is the size of the moves; direction is where price ended up. An hour can cover a large range and still close near its open. Use the full range when your question is about movement and the open-to-close change when it is about direction.
Add indicators only after reading price
A simple moving average is the average of a chosen number of closes. A 20-period average uses twenty quarters of an hour on a fifteen-minute chart and twenty hours on an hourly chart, so changing the timeframe changes what it measures even though the label still says 20. Our moving averages guide explains the common types.
Read volume labels carefully. On many retail forex feeds, volume counts price updates in the interval, not the amount of currency traded across the whole market, because spot forex has no single exchange. A taller volume bar means more updates on that feed.
Keep one clean chart with price and your marked level, then add a single indicator to a copy and ask what question it answers. Several indicators built from the same closes often repeat one signal. Our forex technical analysis guide shows how price structure and indicators fit together.
Charts and order fills can also disagree. A mid-price low of 1.0796 does not prove the ask reached a buy limit at 1.0796. To investigate a missed fill, check the order’s side, the bid or ask history, the timestamp and your broker’s execution rules. The Investor.gov candlestick glossary entry is a useful reminder that a chart summarises prices; it is not an order record.
A two-minute chart reading exercise
Cover the last row of the fifteen-minute table and stop at 09:45. Three quarters have closed. The provisional hourly high is 1.0820, the low is 1.0796 and the latest close is 1.0810. The strongest true statement about resistance is that price touched 1.0820. Write that note down before you uncover the final row.
Now reveal the last quarter. The high extends by 4 pips, the low stays the same and the close rises 8 pips to 1.0818. Your earlier note still stands, and you can explain exactly what changed without pretending you saw the final high in advance.
Then reverse the question. What would prove an hourly close above 1.0820? Only a final price strictly above 1.0820 when the hour ends. A high of 1.0824 cannot prove it, and a close of exactly 1.0820 meets the level but not a rule that needs a close above it. Most platforms have a replay mode for repeating this on real history.
AAFX.IO: read the header before the pattern
Read the header before the candle and the candle before the pattern. In our example, the hour covered 28 pips, closed 18 pips above its open and finished below a level it briefly broke. Each statement answers a different question from the same four prices. Once you can write that kind of note on a clean chart, interpreting the next one gets much easier.
Keep going with our technical analysis hub, the candlestick patterns guide and the Fibonacci retracement guide. When you start acting on charts, our trading orders guide explains how each order type fills. For short chart explainers, follow @arslaninsights on TikTok and AAFX.IO on Instagram.
Affiliate disclosure: AAFX.IO may earn a commission if you open an account through some links on our site. Commercial relationships do not affect our scores, rankings or analysis. Always verify a provider independently before depositing.
Educational information only, not personalised investment advice. Leveraged forex and CFD trading carries a high risk of loss. Chart examples are hypothetical and do not represent live quotes.
Written and reviewed by Arslan Ali Butt, MPhil Behavioural Finance, MBA Finance, with more than 10 years in forex dealing and market analysis. Last reviewed: 19 November 2026.
How we reviewed this guide: Every OHLC, pip and percentage figure was recalculated by hand from the hypothetical EUR/USD data, and chart definitions were checked against StockCharts ChartSchool and Investor.gov on 19 November 2026.
Frequently Asked Questions
How do I know whether the latest candle has closed?
Check the chart’s clock, timeframe and timestamp convention. An hourly candle that started at 09:00 UTC is still forming at 09:52 UTC, so its high, low and close can all change until 10:00. If your rule uses a completed close, act only on the last finished candle and note its time. A screenshot taken mid-hour may look different when you come back later.
What does a gap between candles tell me?
A gap means the previous close and the next open are different prices. In forex it often appears after the weekend, when trading resumes at a new level, or when quotes are missing from the feed. Check the timestamps and market hours before reading it as a burst of buying or selling. If an interval is missing, the path through it is unknown.
What is the best timeframe for reading forex charts?
Use the timeframe that matches how often you can check the market. Daily and four-hour charts suit people who look once or twice a day and filter out much of the noise. Hourly and fifteen-minute charts show more detail but need more attention. Many traders read direction on a higher timeframe and time entries on a lower one.
Why do two platforms show different candles for the same pair?
Platforms can use different feeds, such as bid, ask or mid prices, and different session start times for daily and four-hour candles. Their clocks may also be set to different time zones. Each of these changes which quotes go into a candle. Align the pair, feed, timeframe, session start and time zone before deciding that one chart is wrong.
What do the wicks on a candlestick mean?
Wicks show the highest and lowest prices reached during the period beyond the open and close. A long upper wick means price traded well above where it closed, and a long lower wick means it traded well below. Wicks show where price went, not why. Read them alongside nearby levels and the timeframe before drawing any conclusion about buyers or sellers.
Is a line chart or a candlestick chart better for beginners?
Start with a line chart to see where each period closed and the broad direction. Move to candlesticks once you are comfortable, because they add the open, high and low that you need for levels and stops. Switch between the two on the same pair and timeframe, and hover over one candle to confirm the line point is its close.
Does forex volume show how much currency was traded?
Usually not. Spot forex trades across many banks and venues with no single exchange, so retail platforms often show tick volume, the number of price updates in each interval. More ticks usually means more activity on that feed, but the figure cannot tell you the total value traded across the market. Futures volume from an exchange measures something different.
Can I read charts without using indicators?
Yes. Many traders read only price: the candles, the swing highs and lows, and the levels where price turned before. Indicators are calculated from those same prices, so they add a summary rather than new information. Start with a clean chart, learn to describe it in plain sentences, and add one indicator only when it answers a specific question you have.
How should I practise reading charts?
Hide the newest candles on a historical chart. Pick one completed candle, write down its four prices and work out its body and range in pips. Mark a level from older bars and decide whether a touch or a close counts. Reveal one candle at a time and compare each with your note, recording the unclear cases as well as the easy ones.
Why did my order not fill when the chart touched my price?
Most charts show bid or mid prices, while a buy order fills at the ask. A mid-price low that touches your buy limit may leave the ask a pip or more above it, so the order never fills. Spreads also widen around news. Check which feed your chart uses, the bid and ask history, and your broker’s execution rules for that order type.
Sources & Methodology
Primary-source standard: Market-moving facts should link to original data releases, regulator notices, company filings or official project announcements whenever available. Secondary reporting is used for additional context, not as a substitute for original evidence.
Page last reviewed: