Forex trading strategies are written rules that decide when to enter a currency trade, how much to risk and when to exit, and most of them fall into six setups: trend pullbacks, range trades, breakout retests, failed breakouts, post-news moves and carry. Each one needs different evidence on the chart, a different place where the idea fails and a different amount of room before the first realistic target.
This guide sits under our advanced trading strategies hub. It explains when each setup applies, how to size a position from the stop distance and how to test the rules before real money is at risk. If pips or base and quote currencies are new to you, start with our forex trading guide for beginners.
Risk warning: Leveraged currency trading can produce fast losses that exceed what you planned. An ordinary stop order can fill beyond its trigger, especially around news or a weekend gap. All prices, fills and balances in this guide are hypothetical.
AAFX.IO may earn a commission through links on this page. This does not change our ratings or the strategies we explain.
What is the best forex trading strategy for beginners?
A trend pullback or a range rejection on one liquid pair such as EUR/USD is usually the easiest to practise, because you can mark the level and the exit before price arrives. Easy to practise is not the same as profitable. Pick the setup whose rules you can apply the same way on an unseen chart, then test it after costs.
Which forex trading strategy is the most profitable?
No strategy is profitable in every market. A breakout method can do well in a trending month and lose steadily in a quiet range. Profit depends on the average win, the average loss, the win rate and costs together. A setup that wins only 40% of trades can still make money if winners are twice the size of losers and costs stay small.
Forex trading strategies: overview
- Read the market before choosing a strategy
- Six forex trading strategies at a glance
- Trend pullbacks and range trades
- Breakout retests and failed breakouts
- Post-news and carry strategies
- Turn the stop distance into a position size
- Measure what survives costs
- Test a strategy before risking money
- Who should skip active strategies for now
- AAFX.IO: pick one setup and write its rules down
- Frequently Asked Questions
Read the market before choosing a strategy
EUR/USD breaks above yesterday’s high, then slips back to the same price. One trader sees a pullback to buy. Another sees a failed breakout to sell. Both are looking at the same line. What separates the two strategies is what price must do next, where each trader would abandon the idea and how much room remains before the first realistic exit.
Start by marking the recent highs and lows that led to a clear move away. A pair making higher highs and higher lows offers a different opportunity from one that keeps crossing the same midpoint. If you have to redraw the boundaries after every candle, the market is unclear, and an unclear market can stay off the watchlist.
Next, choose which timeframe sets the direction and which one times the entry. A four-hour chart can be rising while the last few fifteen-minute bars fall. That dip may be a pullback for a swing trader and the whole move for a day trader. Record both intervals before you place an order, because switching charts after a trade goes against you changes the original plan.
Finally, use only information that existed at the time. Yesterday’s high is known at today’s open; today’s high is not. A swing low confirmed by two higher bars only becomes visible once those bars close. Our guide to support and resistance in forex shows how to map these zones without hindsight.
Six forex trading strategies at a glance
A trading style describes how long you hold a position. A strategy describes why the opportunity exists. Swing trading can involve a breakout held for days, and scalping says little about the idea behind a trade. The table compares the six setups by what they need to see and where they fail.
| Strategy | Market it suits | Evidence before entry | Where the idea fails |
|---|---|---|---|
| Trend pullback | Rising or falling swings | Price holds an old breakout area and recovers | A close back through the defended level |
| Range trade | Price turning at both edges | Rejection near an edge with room to the midpoint | Sustained trading outside the range |
| Breakout retest | A clear level about to break | Close beyond the level, then a held retest | Price slips back inside the old range |
| Failed breakout | A range with a false move out | Close back inside after the excursion | Price reclaims the broken level |
| Post-news move | A scheduled release | The first bar after the release closes and the spread normalises | The first pullback breaks the pre-release range |
| Carry | Stable markets with a rate gap | Positive overnight financing on your account | Price loss, a financing change or the time limit |
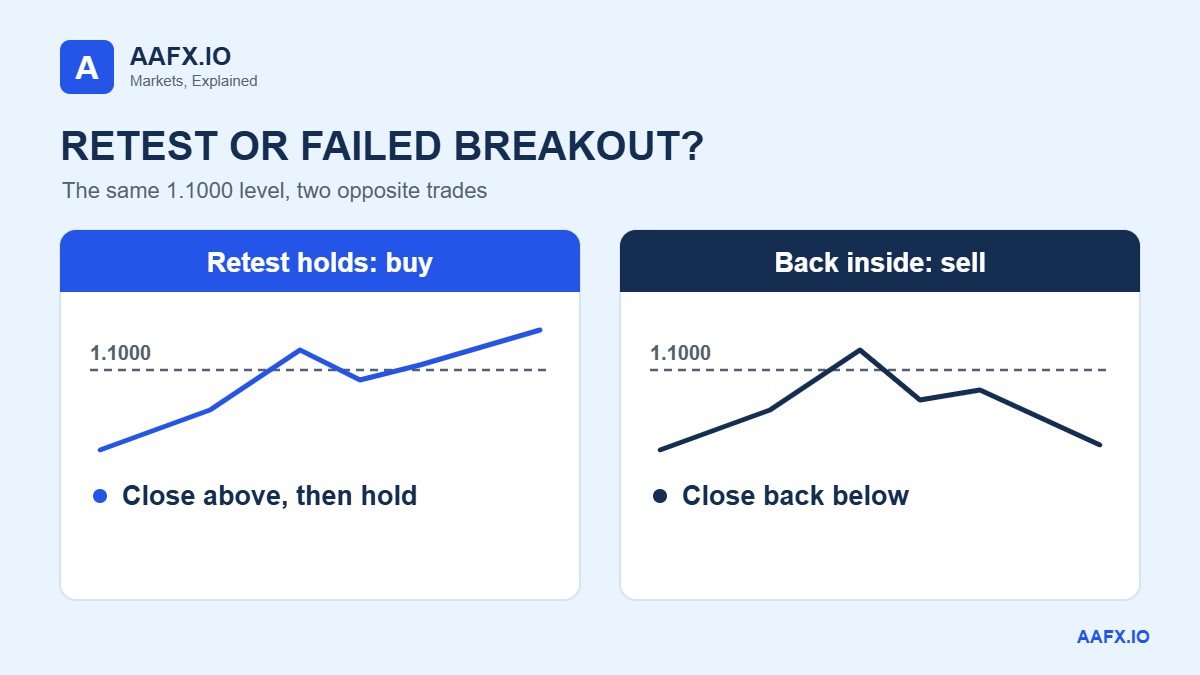
Two setups can use the same level. A move above resistance can be bought as a retest or sold as a failed breakout, depending on what price does next. Write down which setup you are trading before the session starts, so one stopped trade never turns into an unplanned reversal.
Trend pullbacks and range trades
Trend pullback
A pullback trader asks whether buyers who paid higher prices will defend a level on the way back down. Imagine EUR/USD breaks through 1.0850, reaches 1.0900 and then retraces to the old breakout area. A candle dips below 1.0850 and recovers. A buy at 1.0850 with a stop at 1.0825 risks 25 pips. A return to 1.0900 offers 50 pips, twice the risk, before costs.
Now change one detail. The first price you can actually buy at is 1.0870. With the same stop and target, you risk 45 pips to make 30. The chart and the story are identical, but the trade is not. Write a maximum entry price in advance so you can pass without deciding in the moment.
Some traders add a rising moving average as a direction filter. Fix the length and timeframe before testing, because a 20-period average on hourly bars and on daily bars describe very different histories. Our guide to moving averages in forex explains how simple and exponential averages react to new prices.
Range trade
In a range, price repeatedly finds buyers near one area and sellers near another. Suppose EUR/USD has turned near 1.0800 and 1.0900, so the midpoint is 1.0850. Buying at 1.0810 after a rejection, with a stop at 1.0790, risks 20 pips for 40 to the midpoint. Buying at 1.0840 with the same stop risks 50 pips to make 10. The bounces you remember at the bottom do not justify buying in the middle.
Treat the edges as zones, not exact prices. A central bank surprise can end a range that looked reliable for weeks, so decide in advance what takes it off the watchlist, such as a daily close outside the edge followed by further trading beyond it.
Breakout retests and failed breakouts
Breakout and retest
A breakout strategy starts with a level you could identify before it broke, such as yesterday’s high or the edge of an established range. Pick one definition and keep it. Consider a range capped near 1.1000. An hourly candle closes above it, price eases back, tests the area and closes above it again. A buy at 1.1010 with a stop at 1.0980 and a target at 1.1070 risks 30 pips to make 60.
Requiring a retest trades opportunity for information. Some strong moves never come back, and others come back because buying has already faded. Set a time limit, for example three completed hourly bars, so an old pending order cannot open during the next announcement.
Failed breakout
The same boundary can produce the opposite trade. Suppose a range runs from 1.0900 to 1.1000. Price reaches 1.1020, then closes back below 1.1000. A short at 1.0990 with a stop at 1.1025 risks 35 pips, and the midpoint at 1.0950 offers 40. That is only about 1.14 to 1, so a dramatic rejection can still leave little room before the first target.
Post-news and carry strategies
Post-news move
An economic release moves a currency through the gap between what traders expected and what they learned. A rate rise can weaken a currency if it was fully expected and the guidance disappoints. Check release times on our economic calendar, and for policy events use the Federal Reserve’s own FOMC meeting calendar, which separates the statement, the press conference and the minutes.
One testable rule waits for the first fifteen-minute bar after the release to close, checks that the spread is back under a preset maximum, then enters only if the first pullback holds outside the pre-release range. If the usual 1-pip spread is still 4 pips and the target is 12 pips away, the spread alone eats a third of the move.
Carry
A carry trade aims to earn the overnight financing, often called swap or rollover, from holding one currency against another. The amount depends on the pair, the direction and your provider’s terms, not just the central bank rate gap. Assume a position earns $9 of financing over its holding period. If the exchange rate moves $70 against you and other costs total $4, the trade still loses $65.
Carry positions can fall together when many traders exit at once. The Bank for International Settlements’ bulletin on carry trades describes how unwinding leveraged positions can amplify currency moves. Give every carry trade three exits: a price stop, a change in financing terms and a time limit.
Turn the stop distance into a position size
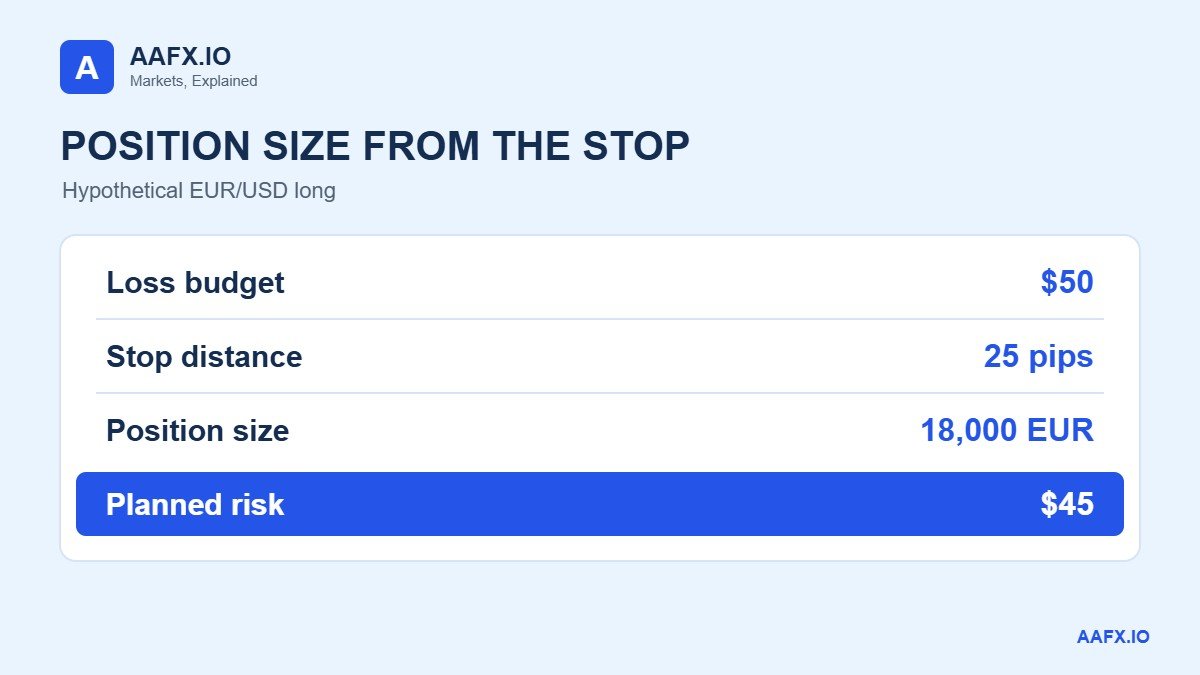
Choose the price where the idea fails first, then turn that distance into money. For a US dollar account trading EUR/USD, one pip is 0.0001 dollars per euro, so a 10,000-euro position moves $1 per pip. The worked example below uses the 25-pip pullback stop from earlier and a $50 planned loss budget.
| Hypothetical step | Calculation | Result |
|---|---|---|
| Planned loss budget | Set before entry | $50 |
| Stop distance | 1.0850 entry, 1.0825 stop | 25 pips |
| Maximum pip value | $50 / 25 pips | $2.00 per pip |
| Size with a cost buffer | 18,000 euros at $0.10 per 1,000 | $1.80 per pip |
| Planned price risk | 25 pips x $1.80 | $45, leaving $5 for costs |
Round the size down to a quantity your account accepts and redo the sums. If the platform only allows 10,000-unit steps, 18,000 euros cannot be placed. One step risks $25; two steps use the whole $50 before costs. A minimum order size can make a sound setup unsuitable for a small account. Our position size calculator runs the numbers for other pairs, and the position sizing guide explains the method in more depth.
Watch the account currency. On EUR/GBP in a dollar account, one pip on 10,000 euros is £1, about $1.25 at a hypothetical GBP/USD rate of 1.2500. Copying the EUR/USD pip value would understate the risk by a quarter.
Margin is a separate calculation. A lower margin requirement does not reduce the profit or loss per pip on the same 18,000 euros, as our leverage and margin guide shows. The CFTC explains dealer pricing and leverage in its retail forex customer advisory. Remember too that a stop-loss is a trigger, not a guaranteed fill: the SEC investor bulletin on stop orders explains why a stop can execute well away from its price.
Measure what survives costs
To compare trades of different sizes, record results in units of initial risk, written as R. If the planned risk is $45, a $90 gain is 2R and a $45 loss is 1R. Fix that denominator before entry. Moving a stop further away and dividing by the bigger number makes a rule break look smaller in the journal.
| Hypothetical 10 trades | Count | Result per trade | Total |
|---|---|---|---|
| Winners | 4 | +2R | +8R |
| Losers | 6 | -1R | -6R |
| Costs | 10 | -0.08R | -0.8R |
| Net result | 10 | +0.12R average | +1.2R |
Under these assumptions, the break-even win rate is 36%. At 36 wins and 64 losses per 100 trades, gross gains of 72R beat gross losses by 8R, exactly the cost of 100 trades at 0.08R. A smaller average winner or a higher cost raises that bar, which is why a win rate alone tells you little.
Costs hit fast strategies hardest. A 1-pip round-trip cost is a tenth of a 10-pip stop but a fiftieth of a 50-pip stop. Our guide to CFD trading strategies shows how the same setups behave on other leveraged instruments.
Test a strategy before risking money
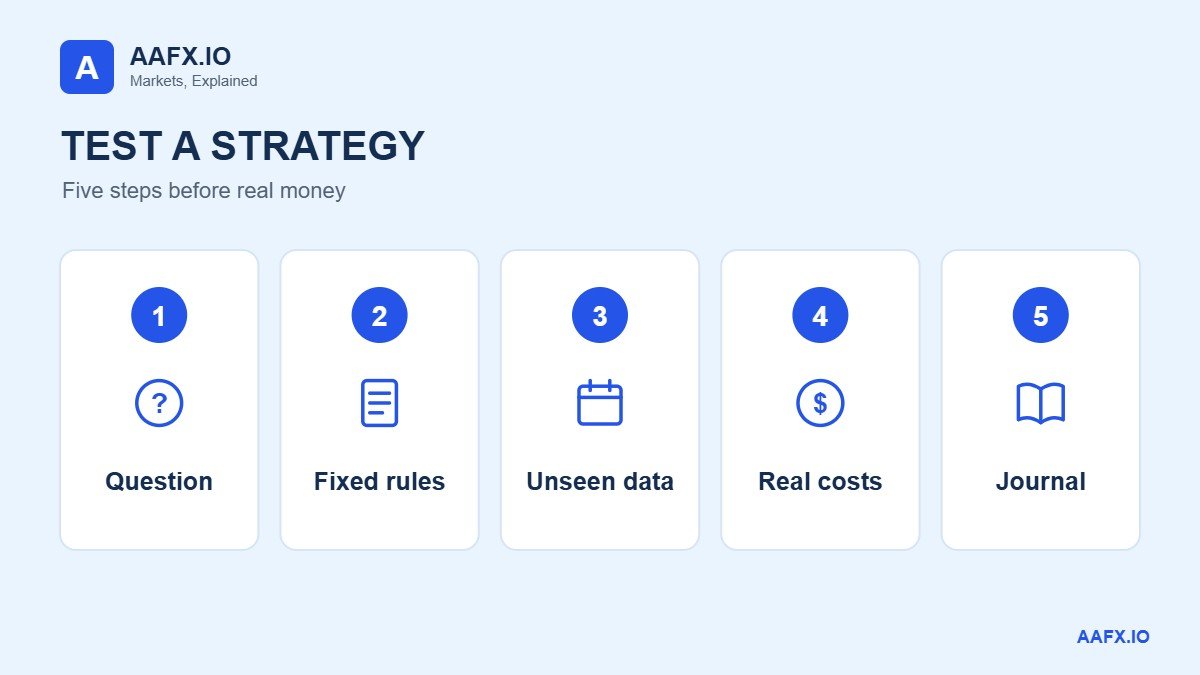
Write a research question that can be answered either way. “Do hourly EUR/USD breakouts that retest within three bars make money after costs in the London session?” names a pair, a trigger and a window. “Does buying strong currencies work?” leaves too much room to decide what strength meant after the fact.
Split your history by time. Build the rules on an earlier period and test them once on a later period you have not looked at. If you change the rules after seeing the later results, that period has become part of development. Replay charts with the right-hand side hidden, enter at the next available price rather than the signal close, and charge realistic spreads on every trade.
Look beyond the final balance. Count trades, average winner, average loser, costs, the longest losing run and the maximum drawdown, the fall from an equity peak to the next low. A forward demo then shows whether signals arrive while you are busy and whether you can enter the size correctly. Record skipped and missed signals too, with a screenshot taken before each decision.
Who should skip active strategies for now
Match the strategy to your week first. Someone who checks prices once after work cannot run a rule that needs a decision five minutes after a release. If your available window produces only a handful of signals a month, a slower setup or a longer timeframe will teach you more.
Check combined exposure. Buying EUR/USD and GBP/USD together means selling the dollar twice. If each trade risks $45, a broad dollar rally can cost about $90 before costs even though each chart looked valid on its own.
Finally, be honest about money and temperament. If a planned loss would interrupt a bill payment, or a losing run would push you to double the next trade, practise on a demo or with paper trades until your records show a tested edge. Following forex trading signals does not remove this step, because you still carry the risk.
AAFX.IO: pick one setup and write its rules down
Choose one pair and one setup. Before the next session, write what would confirm the trade, the price that would cancel it and the entry price beyond which it becomes too expensive. Size it from the stop, log the result even if no trade appears, and review the record after 30 signals rather than after one memorable win or loss.
Continue with our advanced strategies hub, the support and resistance guide and the position sizing guide. For short strategy explainers, follow @arslaninsights on TikTok and AAFX.IO on Instagram.
Affiliate disclosure: AAFX.IO may earn a commission if you open an account through some links on our site. Commercial relationships do not affect our scores, rankings or analysis. Always verify a provider independently before depositing.
Educational information only, not personalised investment advice. Leveraged forex trading carries a high risk of loss. Worked examples are hypothetical and do not represent live quotes or tested performance.
Written and reviewed by Arslan Ali Butt, MPhil Behavioural Finance, MBA Finance, with more than 10 years in forex dealing and market analysis. Last reviewed: 19 November 2026.
How we reviewed this guide: Strategy definitions, sizing and cost arithmetic were rechecked by hand, and regulatory and central bank references were checked against the Federal Reserve, BIS, CFTC and SEC pages linked above on 19 November 2026. All prices and results are hypothetical inputs with the arithmetic shown.
Frequently Asked Questions
How many forex trading strategies should a beginner use?
One, at least until you have 30 to 50 recorded signals. Running several strategies at once makes it hard to tell which rules produced a result, and two setups can disagree on the same level. Learn one method on one liquid pair, keep a journal of every signal, including the ones you skip, and add a second strategy only when the first has a clear record.
Can the same strategy work on several currency pairs?
You can test the same rules on several pairs, but costs and pip values change. A setup built around a small EUR/USD target may have little room left after the spread on a thinner cross. Yen pairs use a different pip size, and session hours affect movement. Check each pair’s contract details and typical spread in your trading hours, and keep separate records before combining results.
What timeframe is best for forex trading strategies?
The best timeframe is the one you can watch consistently. A four-hour or daily chart suits someone who checks prices once or twice a day. Fifteen-minute charts need attention during the session and carry higher costs relative to the stop. Many traders use a higher timeframe for direction and a lower one to time entries. Fix both before you test.
How much should I risk per trade in forex?
Many traders cap planned risk at 0.5% to 1% of the account per trade, so a losing run of ten trades does not cripple the balance. On a $5,000 account, 1% is $50, matching the worked example above. The exact figure is a personal choice, but it should be set before entry and must cover costs and possible slippage beyond the stop.
What is a good risk-to-reward ratio?
There is no single good ratio, because it works together with the win rate. A 2 to 1 ratio breaks even at about 33% wins before costs, while 1 to 1 needs more than 50%. Calculate the ratio from the price you can actually get, not the ideal level. If a late entry drops the ratio below your minimum, skip the trade.
Do forex trading strategies still work during news releases?
Most technical setups become less reliable around major releases, because spreads widen, liquidity thins and price can jump past stops. Many traders flatten positions or avoid new entries for a set window before and after high-impact events. A post-news strategy is different: it waits for the first reaction to settle and only trades when the spread has returned to normal.
How long does it take to test a forex strategy?
It depends on how often the setup appears. A daily-chart strategy may produce only two or three signals a month, so a meaningful sample needs years of history. An intraday method can give 30 signals in a few weeks of replay. Aim for at least 30 to 50 trades across different market conditions before judging the results, then confirm with a forward demo.
Should I use indicators or price action?
Both read the same prices, so the choice matters less than clear rules. Price action uses highs, lows and closes directly. Indicators such as moving averages summarise that history in a line. Adding several indicators built from the same closes often repeats one signal rather than confirming it. Start with price and one level, then add a single indicator only if it answers a specific question.
How do I handle a winning trade that broke my rules?
Record the profit in your account results and tag the rule break separately. A late entry can win because the market kept moving, but one outcome cannot prove that late entries improve the method. If the change looks worth exploring, define it precisely and test it on new data. Keep the original rules intact so both versions can be compared fairly.
When should I stop trading a strategy?
Set the review conditions before you start. Common triggers are costs running well above the tested level, repeated order errors or a drawdown reaching the limit you assigned to the experiment. Pausing gives you time to check whether price behaviour, fills or your own discipline changed. Keep logging eligible signals during the pause, so the review includes what happened afterwards.
Sources & Methodology
Primary-source standard: Market-moving facts should link to original data releases, regulator notices, company filings or official project announcements whenever available. Secondary reporting is used for additional context, not as a substitute for original evidence.
Page last reviewed: